40GE 100GE TAP Aggregator TAP Switch
VPP Traffic Visualization Processor Network Packet Broker / Network TAP Switch
Non-modular flow traction protector
NT-iMXTAP-24G-E Technical White Paper
NT-VPP-5600 series Technical White Paper
NT-FTAP-32QCX Technical White Paper
NT-CFTAP-28XG-D Technical White Paper
Visual control based on the whole life cycle of bypass traffic data
The Solution of "Micro-burst" in SAPN traffic Collection Scenario
It should be responsive and delivered quickly to meet emergency needs
Traffic data deduplication & Path Analysis - the perfect solution
Traffic data Management - NSLP 2.
Backtracking analysis is perfectly applied to NSLP 2.0
The Evolution of traffic data management requirements
Cloud computing network traffic data management
Application of "Packet deduplication" in "Network Visualization Analysis"

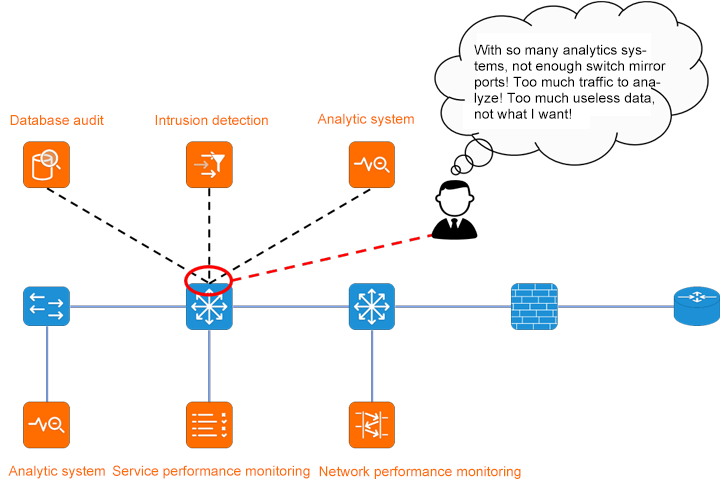
Recently, according to the feedback of a financial industry user, the transaction success rate of the newly launched BPM business performance analysis system continues to be low, which seriously affects the KPI index assessment. According to the preliminary investigation, it is suspected that there is packet loss in the collection node or transmission process of the mirror traffic data collected from the front-end, resulting in incomplete data received by the BPM service analysis engine, and eventually the analysis engine fails in the process of data restoration and protocol reorganization, which further affects the analysis results of the BPM service analysis system.
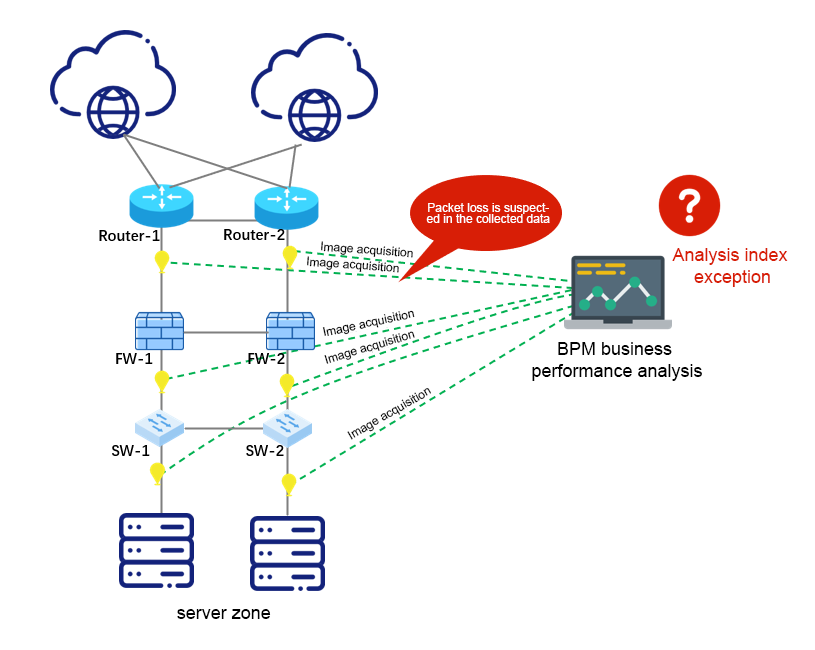
Cause analysis
When an exception occurs in the BPC service performance analysis system, O&M personnel are unable to locate and rectify the fault in the face of thousands of traffic forwarding policies of various requirements of the NPB device. This is due to the large number of NPB device policies, the priority of some policies, and the complexity of data distribution requirements. There are cross-references between policies and ports, which makes the distribution and management of traffic data more complicated. Sometimes, in order to meet the traffic acquisition requirements of an analysis tool (such as network protection actions, emergency drills, and solution verification), newly added policies and original policies are mutually exclusive, affecting all forwarding policies. The root cause of the above situation is the lack of sufficient visual control means of bypass traffic data in traditional NPB.
As the deployment scale and number of NPBS increase, traffic distribution management becomes more complex
In the early days, due to the limited variety and quantity of user bypass analysis tools, a single or a few NPB devices could be used to collect and analyze basic data, and the collection device and bypass traffic distribution management could be completed by configuring a single device. With the increase of bypass analysis tools and the upgrading and expansion of user service networks, the number of nodes to be collected and accessed has also multiplied, and the number of NPB required has also increased. The NPB deployment has evolved from a single deployment in the early days to a large-scale networking deployment. At this time, the independent management and configuration mode of a single NPB leads to low policy configuration efficiency. Moreover, the logical sorting of traffic data forwarding will become more complicated.
• The number of traffic distribution policy items increases exponentially, and policy management becomes more complex
As the types of back-end analysis tools continue to increase, the number of policy entries configured by NPB increases exponentially, and different analysis tools require different original traffic data requirements. Often, one original traffic data needs to be preprocessed and exported by multiple destination ports. As a result, the configuration and management of traffic distribution policies become more complicated.
• It is difficult to sort out the mapping relationship between traffic data input and output
When multiple NPB networks are deployed, traffic data is collected by multiple input interfaces, processed by intermediate NPB devices, and then forwarded. As a result, the transmission paths of traffic data cross and overlap, and the entire distribution process becomes covert and complicated. Due to the limited visual management capability of traditional solutions, it is difficult to sort out the source of traffic data collection, pre-processing actions, and output targets in the face of cross-device and multi-port cross-replication and policy association reference, and thus cannot accurately locate the mapping relationship between the input and output interfaces. The input and output of bypass traffic data become a blank in management.
• The traditional NPB traffic input and output based on "interface" lack of refined management means
NPB forwards traffic data between multiple interfaces through traffic distribution policies, and the input interface, intermediate transmission interface, and output interface can be referenced by multiple distribution policies at the same time. The traditional NPB management perspective based on interface is extensive, and cannot monitor and analyze key information such as the policy matched by an interface, the traffic proportion of the policy, and the traffic trend. Lack of refined management means.
A new generation of visual management solution based on bypass traffic data
Based on the above difficulties in traffic management encountered in the process of traditional NPB traffic collection, Chengdu Digital Technology Company has launched a new visual management and control solution for the whole life cycle of traffic data from collection to output. It perfectly solves the problems such as the source and destination management of bypass traffic data, realizes the on-demand pre-processing of traffic data and flexible and accurate scheduling output, provides strong technical support for the visual, controllable and manageable bypass traffic data, and further improves the user's management efficiency and user experience.
1.The global visual management mechanism for bypass traffic data
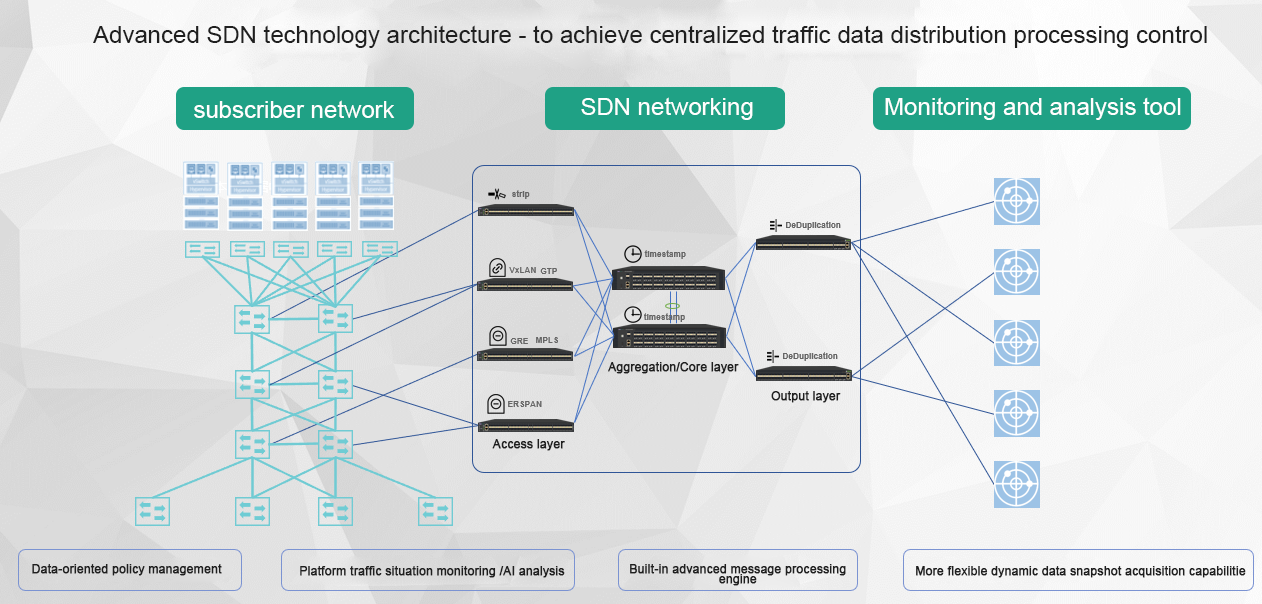
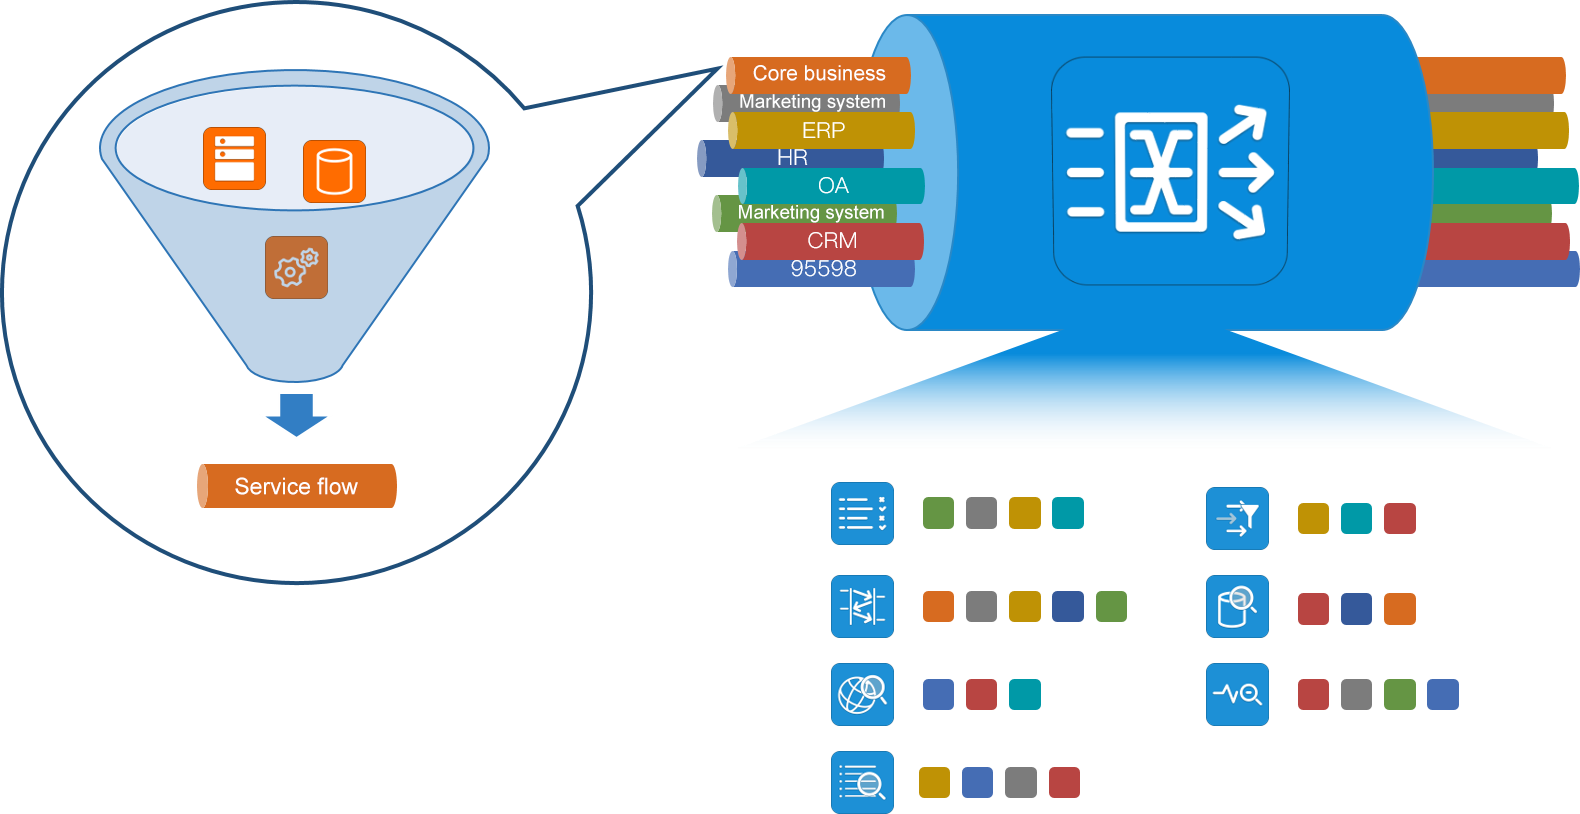
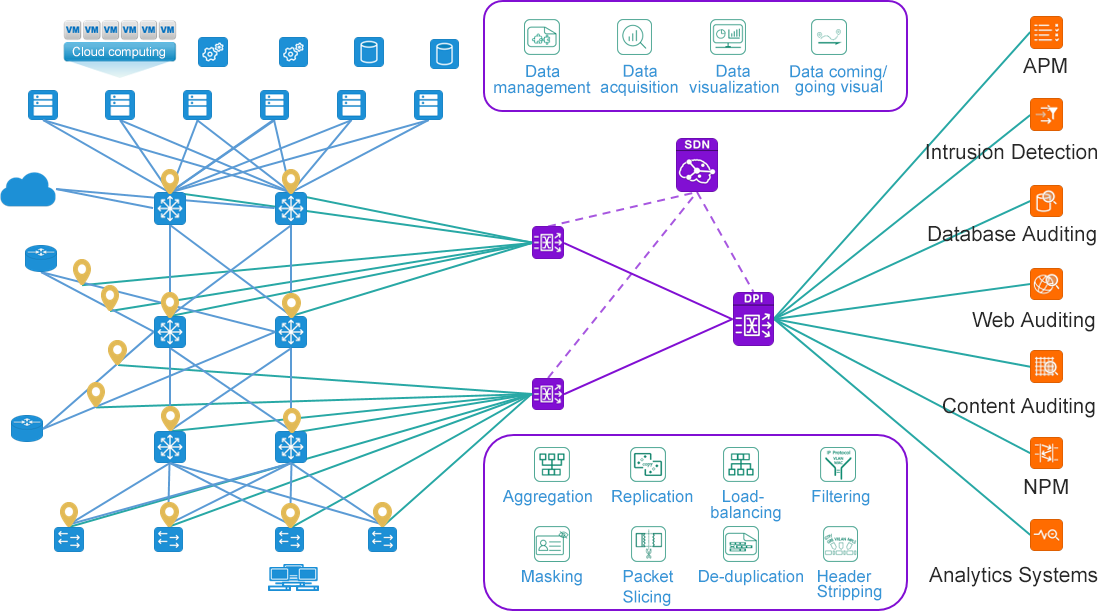
Integration of advanced SDN technology and advanced NP+ASIC chip to build a scientific traffic data collection network, in response to the growing demand for traffic data, increasingly complex traffic data location, content management needs, the use of "traffic data oriented" design, everything from the "traffic data" itself, Collect all aspects of the traffic data of the physical network and cloud network within the enterprise network, achieve comprehensive coverage of traffic data, and eliminate monitoring blind spots. In addition, the traffic data is sorted out based on the type of service data, and the data sensitive characteristics, service interaction characteristics and protocol characteristics of different service interaction data streams have good convergence, so as to establish different classified traffic data for different business systems, and carry out traffic data distribution management and control in different categories. Provide traffic data to different analysis tools according to the principle of "minimizing data rights", so as to reduce the security risk of traffic data bypass leakage and improve the security of traffic data.
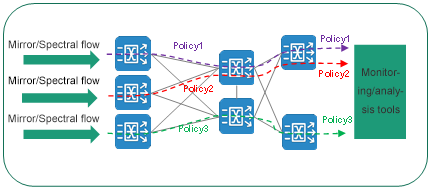
2. The inbound interface perspective distribution visualization
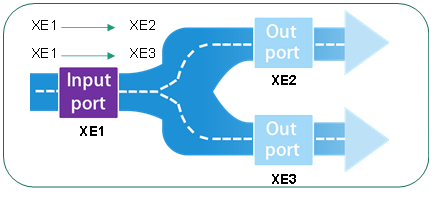
Taking the traffic input interface as a visual object, it is associated to show which output interfaces and corresponding monitoring and analysis systems the traffic in this interface is distributed to, and directly presents the output target of the traffic to the user.
Through the traffic management and control platform, the topology diagram of the user's business network, collection network, and analysis system is displayed in a unified manner. Through this view, the interface through which the input source data of traffic collection is finally output to the back-end analysis system can be quickly located, so as to realize the real-time visual display and control of the input source and final destination of bypass traffic data. To provide more convenient, efficient and intelligent traffic control means for operation and maintenance management personnel.
【Unified Topology Display View】
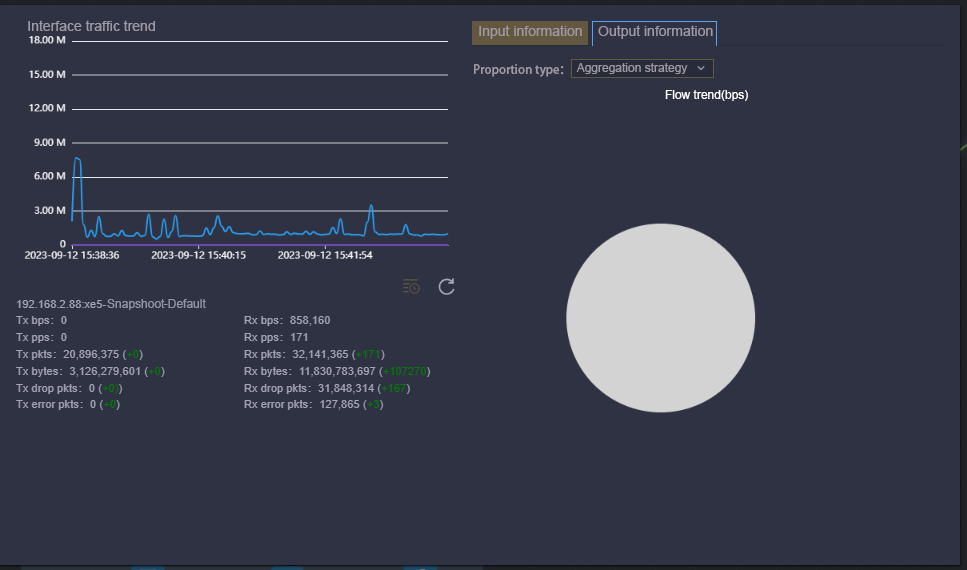
【Interface Traffic Statistics】
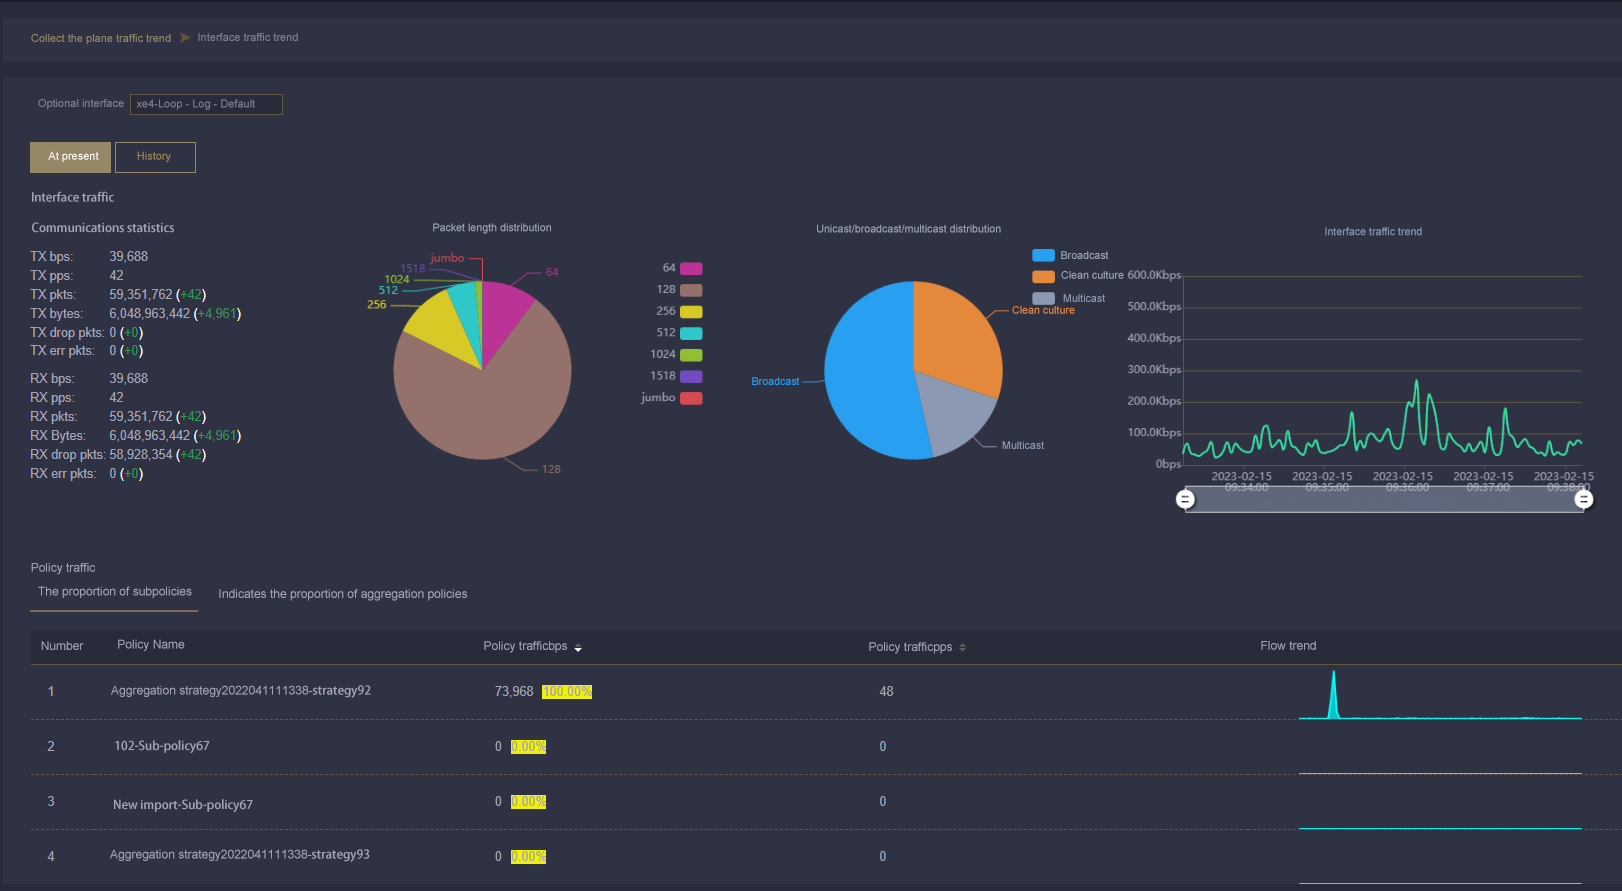
3. Visualization of the traffic of the middle interconnection link of the collection device
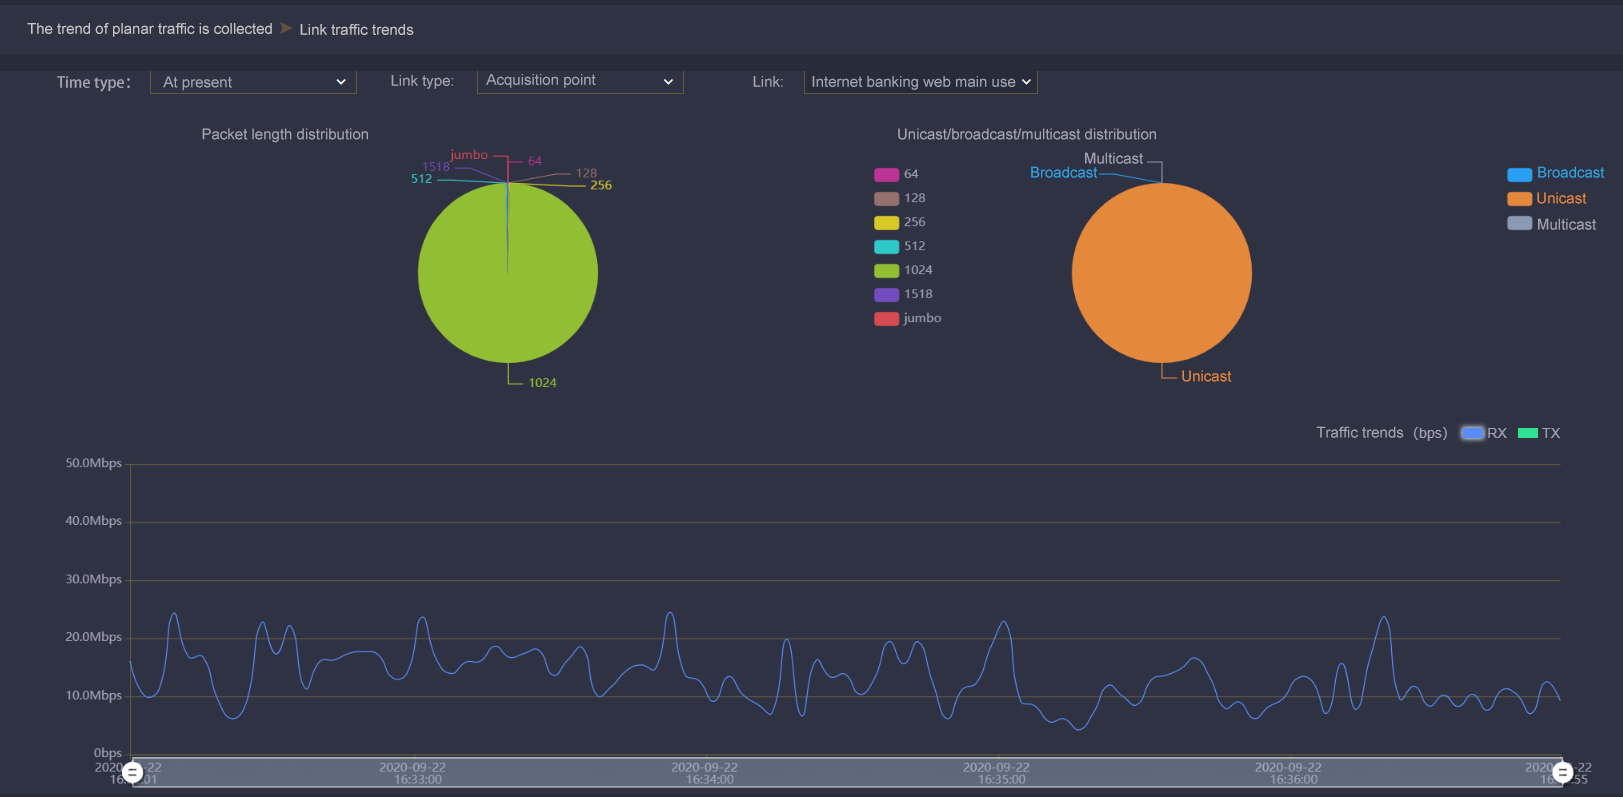
Taking the interconnection link between devices as the visual object, you can view the overall traffic trend status of the link from a macro point of view, and also view the source of the traffic composition, size trend, and associated traffic policy of the link from a micro point of view, so that users can accurately grasp the change trend of each traffic component.
Based on the collection of interconnection links in the network, the centralized visual display view can display the current status of each target traffic, packet length distribution, and traffic trend chart in real time, so that users can see the traffic data status at a glance, and have a visual understanding of the data status of the whole network.
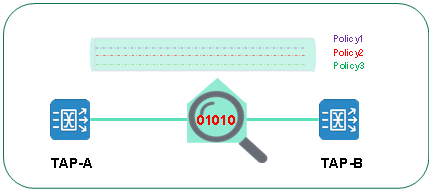
4. Forwarding strategy of the whole network path visualization

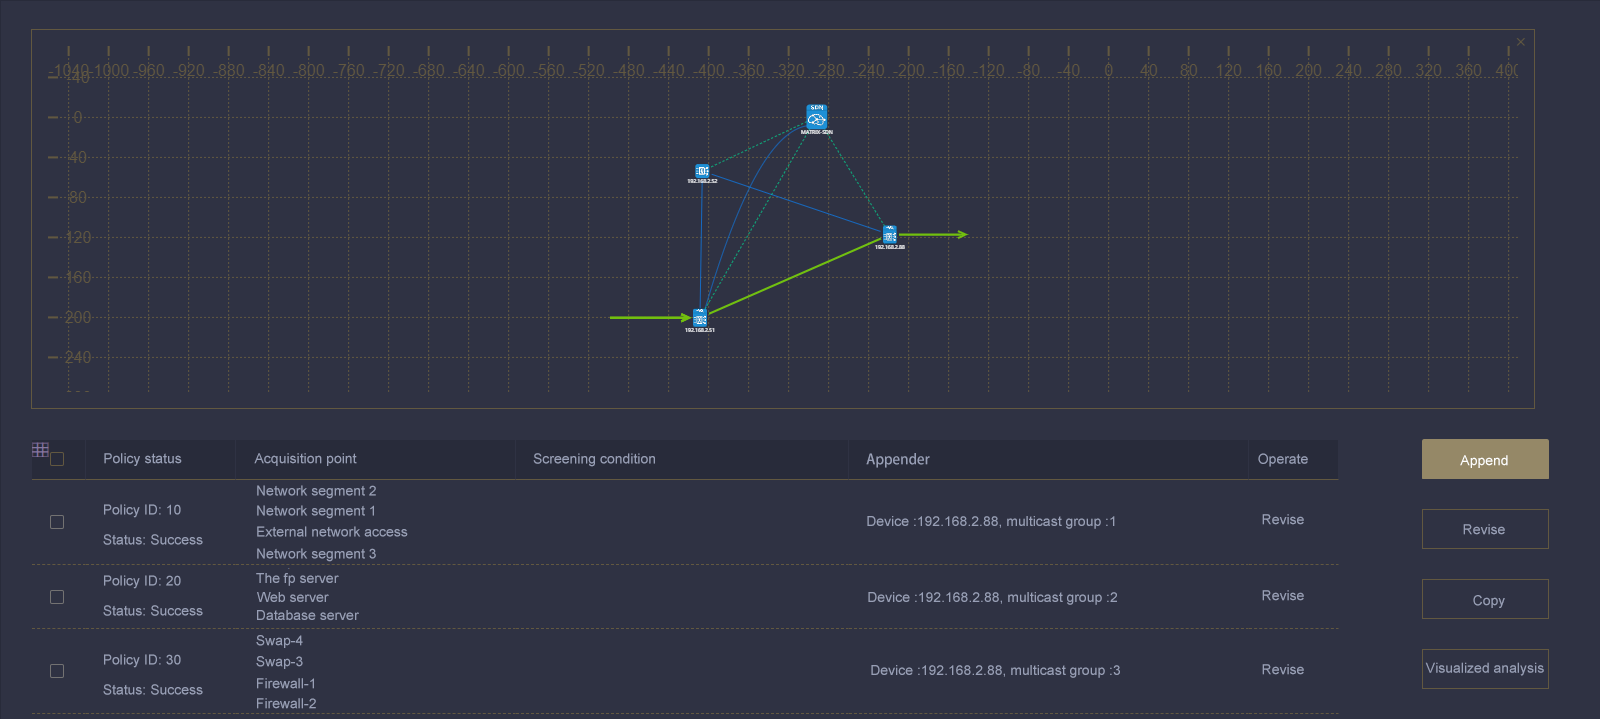
Taking traffic policies as visual objects, the traffic data input source, pre-processing action, transmission path, and output target object are intuitively displayed to users, and the whole process of traffic from input to output is transparently displayed to users.
In terms of traffic forwarding policy configuration and management, the traditional cumbersome operation of logging in to each device separately is abandoned. Through the traffic visualization management and control platform provided by our company, users can define traffic distribution policies across devices as required from the macro level based on the perspective of the entire traffic collection network, and realize efficient batch configuration and centralized delivery of traffic forwarding policies.
5. Visual distribution from the perspective of outgoing interface
Through the visual monitoring and analysis of the output interface, real-time statistics of interface policy hits are displayed. To create different types of traffic data in different business systems, and distribute traffic data in different categories, provide original traffic data to different analysis tools according to the principle of "minimizing data access", so as to reduce traffic data security risks and improve traffic data security.
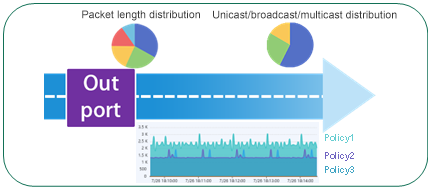
Taking the traffic output interface as a visual object, the traffic composition source, size trend, and associated traffic policy in this interface are displayed, so that users can clearly perceive the details of the traffic data obtained by the back-end monitoring and analysis system.
The value of the visual management solution of bypass traffic data
The visual management solution of bypass traffic data focuses on fast traffic data delivery from "traffic data location source visible", "traffic data content visible", "traffic data strategy visible", "traffic data trend effect visible" and "traffic data output visible". Solve the actual pain points of "slow traffic data delivery, low efficiency and complex management" of first-line traffic data operation and maintenance personnel, improve the efficiency of traffic data delivery and management, and reduce operation and maintenance costs.
With the continuous development of information security detection and IT operation and maintenance technology, a variety of traffic data analysis and monitoring systems are usually deployed in the IT business network. Different analysis systems require different locations and different types of traffic data, which greatly promotes the demand for unified management of bypass traffic data collection. The NPB (Network Packet Broker) equipment is used to build a traffic data collection network, and the unified collection and classification management of traffic data are realized to solve the difficulties of traffic data acquisition and traffic data leakage management, so as to provide technical support for the data source of each analysis system.
Effective collection, preprocessing, classification and forwarding of network traffic data, and accurate control of the whole process are urgent needs of users in various industries. Based on our years of industry experience in traffic data control, this article deeply analyzes the value and pain points brought by different traffic collection and control methods to users. At the same time, combined with our company's continuous cultivation and accumulation in the traffic data collection and control subdivision field, this article launches a more advanced overall solution, leading the design reform of traffic collection network.
The value and pain points brought by traditional NPB traffic collection
In the early stage, the traditional traffic data collection network mostly adopts the access layer + aggregation layer network architecture, as shown in the following figure.
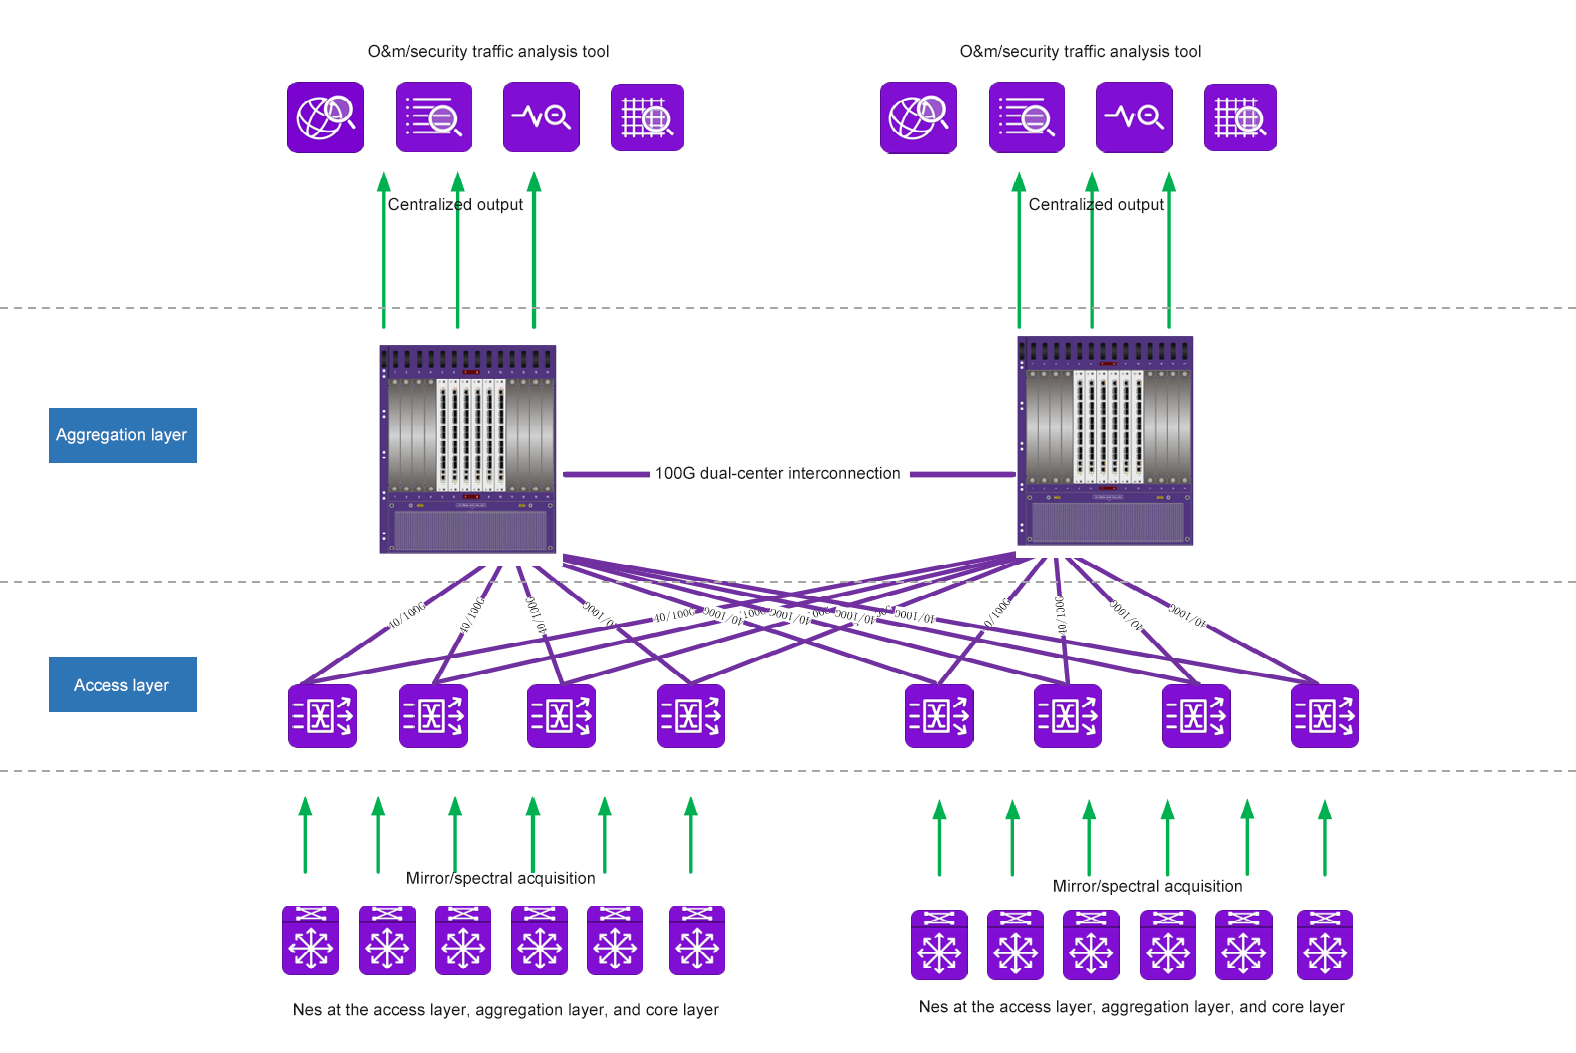
Architecture Design Features
In the early traditional traffic collection network, the number of devices in the access layer is larger than the number of devices in the aggregation layer. If too many data forwarding strategies are configured in the access layer, it will greatly increase the overall complexity and workload. It meets the access requirements of different interface rates and different media, so the access layer equipment usually does not have the ability of advanced traffic data preprocessing, and only implements simple traffic data collection, replication, aggregation, forwarding and other functions.
The aggregation layer usually uses one or more devices to centralize the aggregation and output the uplink traffic of the access layer. Aggregation layer devices generally integrate advanced network traffic preprocessing capabilities, such as deduplication, slicing, time stamping, DPI application layer identification, tunnel protocol encapsulation stripping and other functions. After the collected network traffic data preprocessing is completed, it is centralized output to the third-party analysis system according to the policy distribution requirements, so as to meet the requirements of the analysis system for traffic data source acquisition.
1. Traffic management is still chaotic, and the source and destination can only be managed by configuration file text and configuration table.
2. The simple traffic of the access layer converges to the core, which inevitably leads to the occurrence of aggregate congestion packet loss.
3. Lack of visual and unified data management means, when there are several or even dozens of scale traffic access, the pressure on managers is huge.
4. The delivery of traffic forwarding strategy is difficult. When the analysis system has new traffic acquisition requirements, the location of traffic source and the back and forth verification of traffic will greatly increase the time of traffic delivery, and conflicts between different strategies are easy to occur.
5. The aggregation equipment is expensive and has poor scalability. The expansion of the machine frame board seems flexible, but it is a means of binding users.
6. Equipment configuration is complex, management and maintenance is poor, inflexibility, adding equipment is difficult, upgrading is difficult, it is difficult to achieve high reliability, high redundancy and load balancing, and the business is interrupted.
Value to the user
The value of traditional NPB networking method to users is that it can realize the centralized collection and output of the whole network traffic through networking. It solves the problem that different analysis systems compete for mirror port resources in the business network, and meets the needs of third-party analysis systems for network traffic data acquisition.
Pain point -unified collection in form, decentralized management in nature
Although the traditional NPB networking method can solve the problem of users obtaining network traffic data, it also faces many networking difficulties:
In-depth analysis of advantages and disadvantages of access-sink NPB design architecture
Frame aggregation device architecture principle
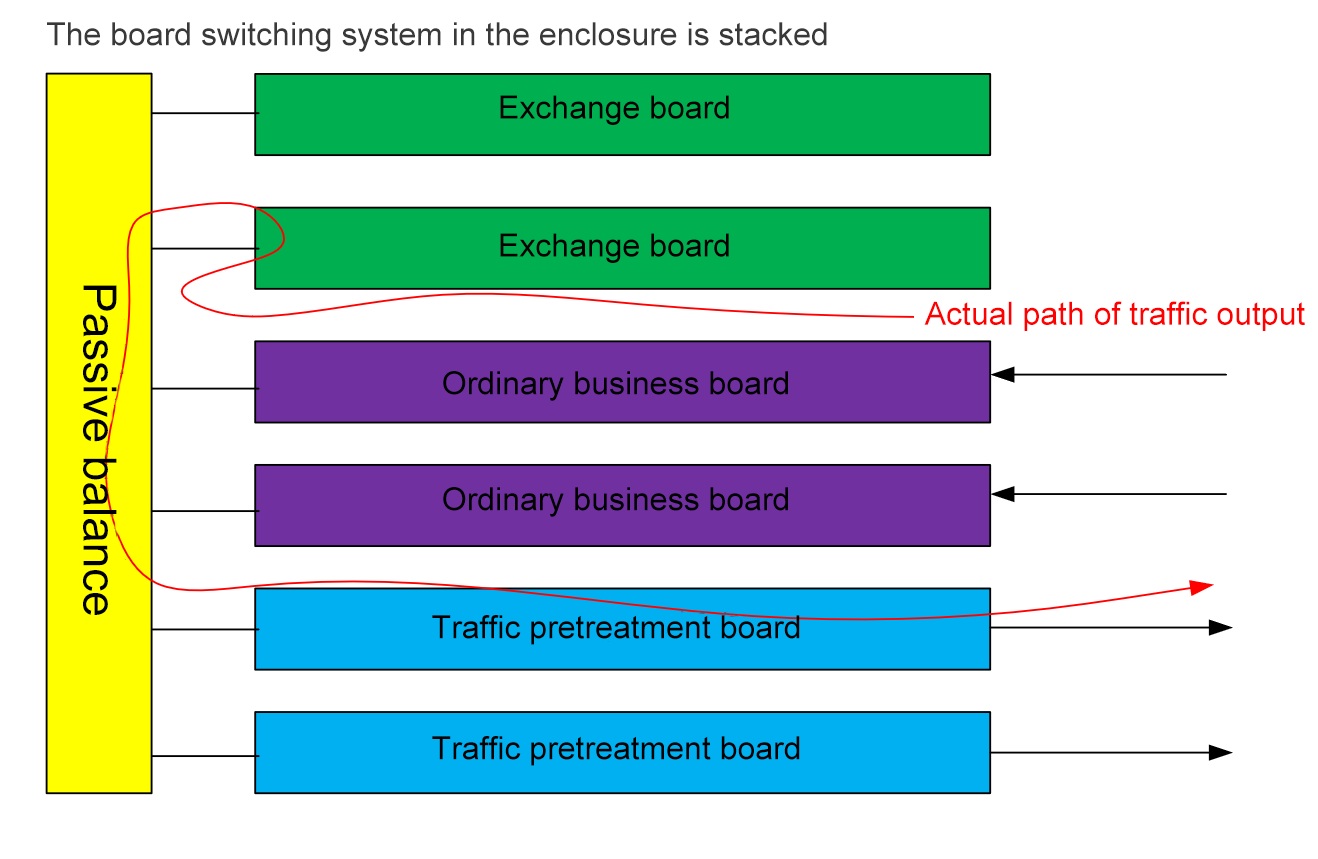
The diagram above shows a simple frame device architecture principle that enables board-level scaling, but it requires using the same manufacturer's board. At the same time, it also faces the following problems in the later use process:
1. It is necessary to accurately predict the future expansion demand. In the early stage of the project, it is necessary to choose the appropriate frame capacity, and choose between different slot numbers such as 2 slots, 6 slots, 7 slots and 14 slots. Frame cost varies with capacity, and increases exponentially for non-ATCA standard architectures.
2. The topology of the frame backplane is fixed, which determines the fixed interconnection bandwidth between different slot boards.
3. Some manufacturers with strong technology accumulation have realized unified board slot addressing, which can realize unified configuration management of the board in the frame by means of internal exchange stacking integration. However, in the case of dual core interconnection, if the machine frame stacking is realized, the effect is usually not good, which is reflected in the representative foreign friend’s business products. Usually, the system response is slow after stacking, and there is a risk of brain split.
4. Some manufacturers still manage each board separately and need to configure each board independently, only realizing the unified frame shape in form. Users even need to pay attention to the invisible topology structure of the backplane when configuring, which is complicated to manage and configure.
Access layer devices have simple traffic aggregation and lack of traffic classification preprocessing, which aggravates uplink port congestion
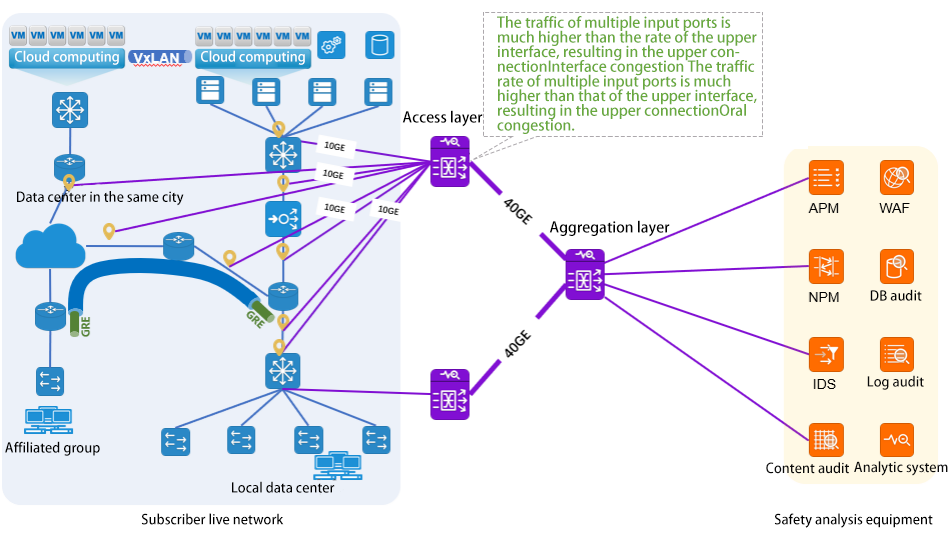
As shown in the figure above, when the access layer acquisition unit is deployed in different areas of the user's existing network, when there are multiple acquisition links in the area, if the access layer acquisition unit only supports simple duplication, aggregation and forwarding of traffic data, and cannot do fine classification and preprocessing of traffic data, it is easy to cause that the traffic data of multiple input interfaces is far greater than the forwarding rate of the uplink interface. As a result, the uplink interface congestion, when serious, there will be a large packet loss rate, and eventually lead to the accuracy of the back-end analysis system analysis.
Inefficient traffic delivery, traffic source reasoning -> configuration policy -> repeated verification
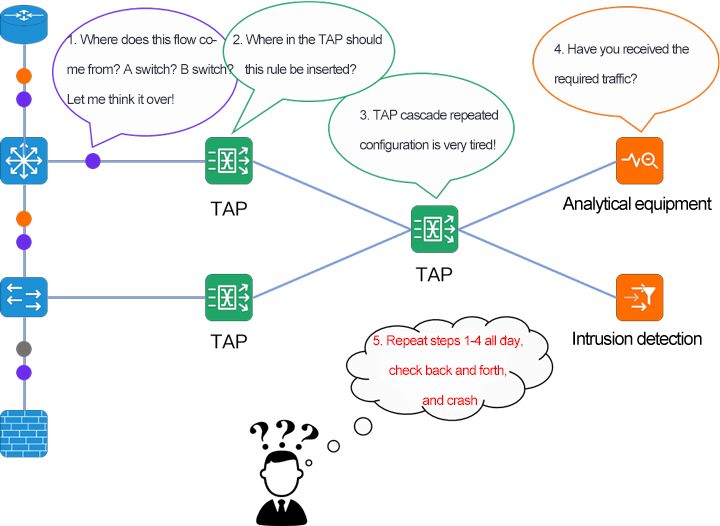
In the traditional architecture traffic collection network established by NPB, the processing mechanism of the network is based on the process of hop-by-hop execution of each node. In order to realize the traffic traction strategy across NPB devices, managers need to log in to each NPB to configure traffic traction actions.
In the case of the frame aggregation topology design, it is impossible to manage the devices of the whole network access layer and the aggregation layer in a centralized way. If the access layer needs to flexibly output traffic at any location, the traffic policy needs to be configured hop-by-hop on at least three devices, which greatly increases the workload of the administrator. Long-term maintenance will lead to policy confusion and unmanageable.
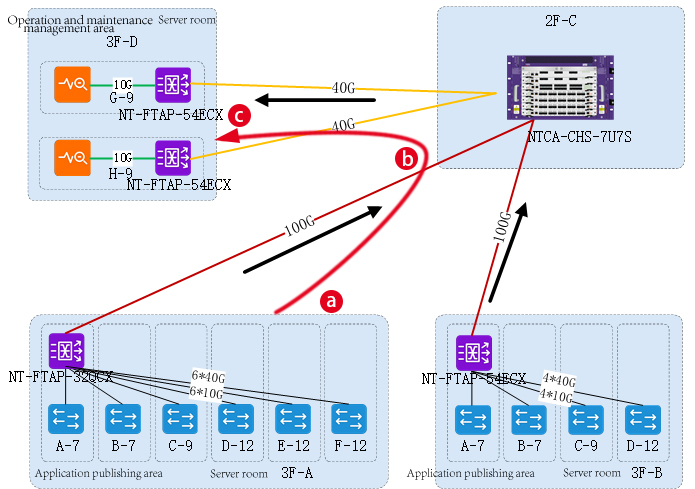
For example, if you need to analyze the traffic data in the application release area in the 3F-D computer room, you need to configure the following three equipment related policies: a.3F-B room NT-FTAP-54ECX -> b.2F-C room NTCA-CHS-7U7S -> c.3F-D room NT-FTAP-54ECX. If the policy configuration is abnormal, the back-end analysis system will not be able to obtain the required data, so the staff needs to repeatedly find the abnormal configuration link in the above three steps.
The complexity of cross-device traffic delivery is high, and large-scale centralized aggregation layer policy processing is a compromise
In most cases, user business systems are distributed in different physical computer rooms or different geographical locations. When collecting network traffic data in different business areas, it is necessary to deploy NPB access layer acquisition units in the corresponding areas. At the same time, when the analysis system is distributed in various regions and needs traffic data in different physical locations, it will become very complex to configure the traffic data forwarding strategy in the access layer of each region, and it needs to be repeatedly confirmed hop-by-hop configuration. Therefore, in the case of large-scale centralized collection, the configuration of traffic data forwarding strategy at the aggregation layer becomes a compromise means, and the flexibility and scalability of the configuration of forwarding strategy at the aggregation layer will become poor.
It wastes the TCAM table entry resources of the access layer device and has no traffic classification ability
Because the NPB device has no routing table and MAC table to participate in the work, the device has no real concept of addressing, but pushes data based on the interface. In order to ensure that the traffic data can be sent to the destination interface correctly, it is necessary to customize the strategy of the NPB device to push or pull the traffic data.
In the traditional NPB network, each device needs to configure and execute the policy independently. The device will convert the defined traffic data forwarding policy into flow table and send it to TCAM, and finally the device forwards the traffic data according to the TCAM table resources. Most of the traffic data forwarding strategies, traffic data classification and traffic data preprocessing are implemented in the aggregation layer equipment, while the access layer only does simple traffic data forwarding, which will occupy a lot of TCAM resources of the aggregation layer equipment. However, the TCAM resources of the access layer devices are wasted.
The NPB traffic preprocessing unit is limited by the core layer device capabilities
In traditional networking methods, data forwarding is mainly realized based on the processing capacity of frame devices in the core layer. However, there are performance bottlenecks of frame devices, including the number of FABRIC channels of the switching board and the data channels of the service board.
In the traditional networking mode, the machine-frame traditional architecture only achieves vertical expansion capability, that is, in-frame board-level expansion. Limited by the slot capacity of the machine frame, it is necessary to accurately predict the future expansion demand, and it is necessary to choose between cost and demand in advance.
Design change of traffic collection network after SDN endow NPB with networking ability
Software Defined Network (SDN) is a network architecture with centralized control, and the SDN controller can realize centralized control in a real sense. The NPB network based on SDN technology can realize the centralized and unified management of traffic data traction/distribution strategy. It includes service oriented traffic data management and traffic distribution target oriented management. Try to shield users from the underlying implementation and focus on managing the data itself. SDN has the characteristics of routing intelligent calculation. By operating the NPB platform of SDN, the SDN controller can automatically realize the multi-tap cluster path automatic calculation and intelligent delivery strategy. Managers only need to worry about the input and output, and no longer need to worry about the implementation and routing. Based on SDN technology, highly reliable redundant NPB network can be built with failure recovery mechanism. When the NPB network failure comes, it can automatically converge to deal with equipment or link failure to ensure the recovery of traffic traction. At the same time, SDN network can realize the load balancing function of complex NPB traction environment, and users can build efficient non-blocking wire-speed switching NPB network. In general, the NPB networking based on SDN technology can greatly improve the efficiency of management work and ensure the stable and continuous work of the network.
1. Unified information management of the location, source and destination of traffic collection, making it easier to sort out traffic.
2. The traffic snapshot mechanism makes it easier for customers to confirm the traffic content of each traffic collection location. Easily locate where desired target traffic should be found.
3. Users only need to pay attention to the input/output of traffic, and the path is automatically calculated, which greatly simplifies the user's configuration work.
4. Each policy configuration and traffic confirmation of each collection point can be easily verified on the SDN platform.
Design architecture change - access + convergence -> CLOS switching architecture
The NPB network based on SDN technology can realize:
After years of continuous investment and research and development, our company adopts the advanced SDN technology concept and designs a traffic data acquisition network with CLOS switch architecture, in order to better meet the traffic data acquisition network construction of different scales of users in various industries.
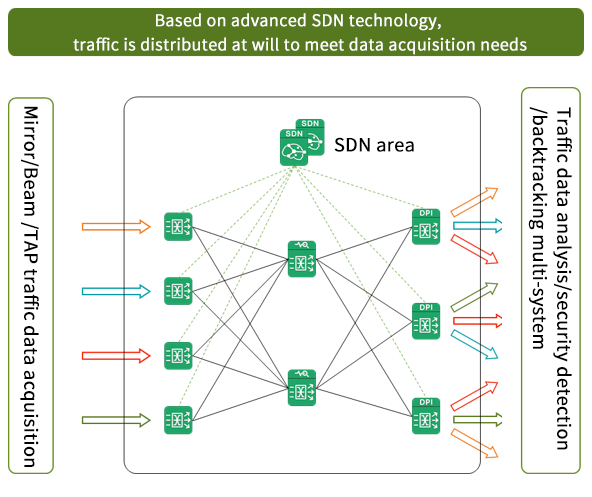
Instead of the traditional access + aggregation layer networking method, the SDN technology was the core, and the advanced architecture of separating the "control plane" and "data plane" was used as the guiding ideology. The traditional traffic collection hardware was SDN, which provided flexible networking capabilities for the unified collection and distribution of traffic data.
In the network architecture, it adopts the CLOS networking architecture, inherits the inherent advantages of CLOS networking architecture, and realizes the whole network non-blocking data exchange even in the case of large-scale networking. At the same time, the scalability of the network is further strengthened under the network architecture. With the further expansion of the collection scale, the number of collection units can be elastically expanded at different levels to meet the upgrading and expansion of the traffic collection network in a more flexible way
Simple centralized output - > local output + on-demand remote aggregation traffic traction, full use of NPB capabilities
The standard CLOS architecture was used for layered networking, and the whole traffic collection network was divided into access layer, core convergence layer and output layer. In the input layer device selection, NPB acquisition units with 10-20G level advanced functional processing capabilities can be selected, and preprocessing actions such as packet deduplication, slicing, DPI offloading, and package peeling can be performed based on traffic orchestration strategy. For example, when there is local room traffic data to be output locally, there is no need to transmit this part of the traffic to the aggregation layer and then return to the local computer room after preprocessing, so that it can greatly reduce the occupation of physical transmission resources across the computer room, reduce the workload of network wiring, reduce the configuration and management of equipment traffic forwarding strategy, and shorten the delivery cycle of traffic data. Better meet the needs of local output traffic data.
For the traffic data that needs to be exported remotely across physical computer rooms, it can be centrally scheduled and distributed on demand through the SDN controller according to the traffic data distribution strategy. When there is a large amount of traffic data requiring advanced preprocessing, the SDN controller can automatically select the acquisition unit with more powerful advanced processing capabilities for preprocessing. After the preprocessing is completed, the traffic data is intended to be output to the output port of the specified device according to the traffic data distribution strategy.
The Matrix-SDN traffic management platform of our company can perfectly realize the goal of local output of traffic data and on-demand remote aggregation traffic traction, and all of these are achieved thanks to the application of SDN technology, which realizes the centralized management and control of the whole network equipment by the SDN controller, and realizes the unified view management of traffic scheduling strategy. The flow data is output flexibly on demand.
At the same time, according to the need, can filter out useless background traffic data on the access layer device, such as video, voice, pictures and other large traffic data, reduce the uplink port bandwidth occupation, reduce the uplink port congestion.
Traffic classification preprocessing handles at the access layer -> Make full use of access layer TCAM resources, reduce invalid background traffic transmission, and alleviate uplink port congestion
As mentioned above, the network architecture of traffic collection network launched by our company adopts a hierarchical way, and the classification and preprocessing of traffic data are completed in the access layer instead of the core aggregation layer. It makes full use of the TCAM resources of NPB devices in the access layer, and eliminates the dilemma of insufficient TCAM resources of core aggregation layer devices when a large number of traffic data distribution strategies are required.
More intelligent routing selection strategy makes full use of topological redundant path intelligent selection to maximize the guarantee of data delivery
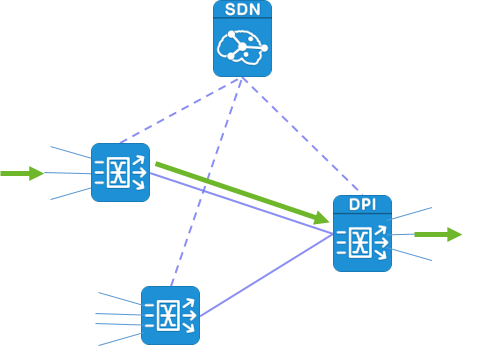
Based on the centralized SDN controller, it can achieve more intelligent routing, higher reliability and more convenient management features. Using the standard OpenFlow/Netconf interaction protocol, the central SDN controller can fully and globally grasp all the links, devices and ports information in the traffic collection network. Based on the policy requirements of user configuration, the central SDN controller can intelligential decompose into hobby-hop flow tables, which can be automatically updated according to the change of the network topology state in real time. The complex routing process is completely shielded for users, and users no longer need to pay attention to the internal routing strategy of traffic, which simplifies user management and improves the reliability of traffic data collection network.

Introduction of advanced routing features such as CLAG/ECMP

As the basic platform of the whole network traffic data center, the controller supports the high reliability and redundancy of HA master and backup, which further ensures the reliability and stability of the traffic data platform. Through MATRIX-SDN platform, cross-regional traffic data collection and control can be better realized.
SDN Technology
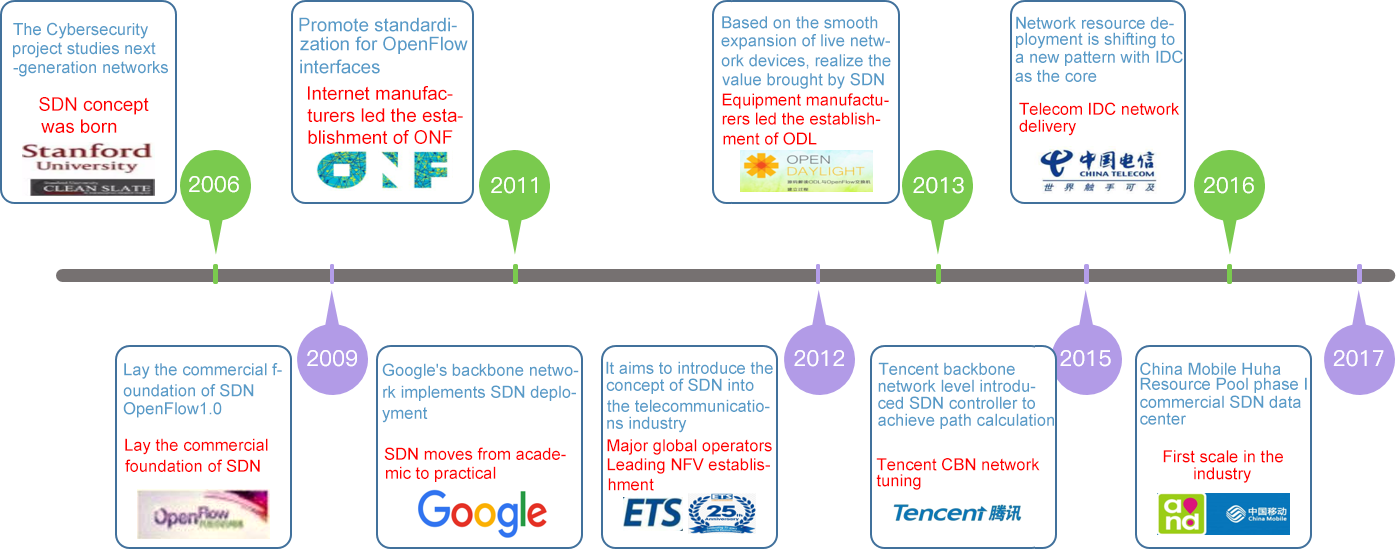
The Rise of SDN technology
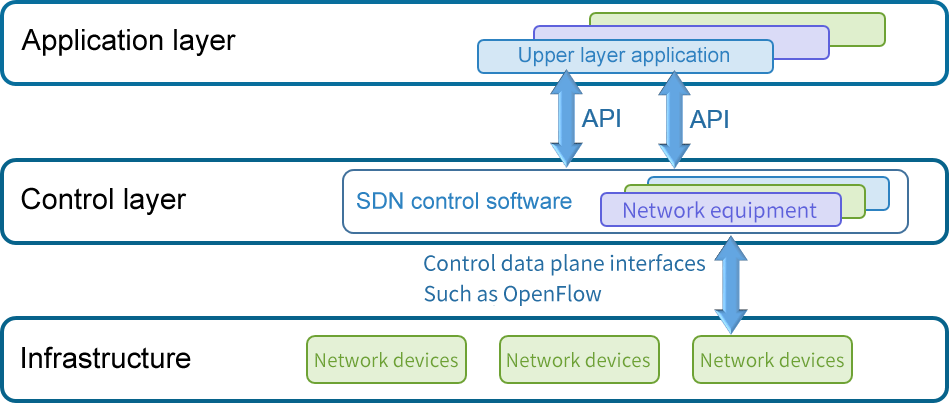
Software Defined Network (SDN) is a new network innovation architecture proposed by CLean State research group of Stanford University in the United States. It can define and control the network through software programming, and has the characteristics of separation of control plane and forwarding plane, open and programmable.
It has been more than 10 years from the concept proposal and continuous engineering practice to the wide application of SDN technology and its branch technologies in various industries. In today's data center, WAN, transmission and other fields, SDN technology and its technical ideas have been generally blossoming and bearing fruit, becoming the basis of intelligent and intentional network in the future.
The core advantages of SDN technology
Network simplicity: Provides a unified view of the network architecture, enabling a unified view of the entire network architecture, thus simplifying configuration, management, and optimization.
High utilization: Centralized traffic engineering allows us to effectively adjust the end-to-end traffic path to achieve efficient utilization of network resources.
Fast failure repair: link and node failures can be quickly repaired. Moreover, the system can quickly aggregate network resources, achieve equal distribution, and predict some network behaviors.
(2) Support virtual migration and unified operation and maintenance;
(3) Support multi-service and multi-tenant.
Smooth upgrade: The separation of the control plane and the forwarding/data plane allows for smooth software upgrade without packet loss or performance degradation.
Elastic computing: Large-scale computation, path analysis are integrated in the controller, done by the latest generation of servers.
The Application of SDN Technology in the current Network
Data center network: The data plane and control plane of traditional network equipment are separated, and a centralized controller (controller) is used to manage and configure various network devices with standardized interfaces. The programmable feature brought by this architecture to the network makes the design, management and use of network resources more possible, which makes it easier to promote the innovation and development of the network. Therefore, separation of control and forwarding, centralized control of logic, and open network programming API are regarded as the three main features that distinguish SDN from traditional network technologies. It is these characteristics that make SDN well suited to meet the needs of data center networks:
(1) High scalability and network resource utilization;
SDWAN stands for Software Defined Wide Area Network: it is a service formed by applying SDN technology to the wide area network scenario. This service is used to connect a wide geographical range of enterprise networks, data centers, Internet applications and cloud services. Since SD-WAN is an application driven by technology, there is no unified definition in the industry, and various industry analysis and consulting organizations such as IDC and Gartner have different definitions. In contrast, the definition proposed by SDxCentral can simply reflect the core idea of SD-WAN, that is, "SD-WAN is a service formed by applying SDN technology to the wide area network scenario, which is used to connect a wide geographical range of enterprise networks, including enterprise branches and data centers.
SD-EN(SDN based Enterprise Network) focuses on WAN connection at the user side, and provides an efficient SDN-based solution for the connection between enterprise headquarters and branches across WAN. SDN based DataCenter Interconnection (SD-DCI) is an SDN-based solution for the interconnection of an enterprise's data centers or between its offices and data centers. Cloud interconnection SD-CX(SDN based Cloud Exchange) pays more attention to the WAN connection on the application side, providing efficient SDN-based solutions for public clouds, private clouds and more and more hybrid cloud applications.
Challenges in traffic data management
With the continuous development of network intelligence, around the needs of network operation and maintenance, network security operation and maintenance, business operation and maintenance are constantly facing new challenges. The technical means of breadth analysis and depth analysis based on traffic data play an increasingly important role in the field of network monitoring and analysis/security threat detection and analysis/business monitoring and analysis. This has led to a significant increase in demand for the enterprise side channel traffic data management itself:
The growth of traffic data demand collection locations - from the former traffic data collection needs of important and critical locations in the network to the growth of traffic data collection needs covering the vast majority of network element locations in the whole network, from the former traffic data collection only needed to exchange a few network locations in the core layer and critical resource areas, Up to now, it is necessary to monitor and collect data everywhere in all key positions of the network (core layer, server area, remote access area, DMZ, etc.), sinking to the convergence layer, access layer, virtualization layer, remote public cloud and other networks.
Increasing demand for diversified/refined distribution of traffic data content - The demand for traffic data content varies from full data to different analysis dimensions and analysis objectives, requiring more diversified and refined traffic data content. For example, business-based monitoring analysis only needs accurate business-related traffic data. Based on the special traffic audit (database audit, business access behavior audit) only needs special traffic content; This puts forward new requirements for the distribution management of traffic data.
Traffic data management challenges
(2) The source/destination management of traffic data is confused;
(3) It is difficult to obtain virtualization/cloud network traffic data;
(4) The unrestricted distribution of traffic data faces the risk of leakage;
(5) The traffic data of service network and mirror in SDN network is easy to cause the problem of traffic data pressure overrun.
In many small and medium-sized customers, multiple separate traffic collection devices (convergence splitters) are deployed, and the "formal" unified management of traffic collection devices is realized by means of SNMP-based information collection and centralized management of devices based on "stacking" technology. To a certain extent, the convenience of equipment management is realized for administrators. However, in the actual process of traffic data management, there are still very large management defects:
(1) The increasing demand for traffic data leads to delivery difficulties;
Equipment centralized management ≠ traffic data management
The "formal" traffic collection device management is realized based on SNMP information collection, which realizes the convenience of device management for administrators to a certain extent, but there are still very large management defects in the actual process of traffic data management: The management function of SNMP is extremely limited. At best, it can only be regarded as centralized monitoring of device status/port status, which is far from "data management". SNMP protocol is oriented to the port management of the acquisition device, which can not be completely associated with the user's data source, destination and strategy, and it is difficult to manage the user's actual use.
The technical fundamental disadvantage of centralized device management based on "stacking" technology is also obvious. Due to the limitation of "stacking" technology, the number of stacked devices is directly related to the management performance. Although theoretically, the underlying ASIC chip can support the stack management of up to 128 switch units, in practice, limited by the control plane performance of the device and the complexity of the interaction between the devices, most manufacturers' devices cannot realize the stack of more than 8 devices. After "stacking", the system reliability and system performance are significantly decreased, and the configuration complexity of the "stacked" system is not substantially reduced. After multiple devices are stacked, essentially the configuration file of a device is a set of configuration files of multiple devices. Administrators will have to understand more complex stack topology structure, and the distribution management strategy for traffic data itself becomes more complex and difficult to understand.
Solution -SDN controller + platform to achieve "traffic data oriented" management
In response to the increasing demand for traffic data and the increasingly complex management of traffic data location and content, only by adopting the design method of "traffic data oriented", starting from the "traffic data" itself, and doing a full range of traffic data collection and traffic data management in the enterprise network, can we consolidate the cornerstone of traffic data. Truly support IT system operations/security business needs.
(1) Traffic data source/destination/processing management;
(2) Traffic data content identification and classification management;
(3) The management of traffic data demand-oriented target system;
(4) WYSIWYG is an important prerequisite for traffic visualization.
SDN technology gives new capabilities to traffic data management
Benefiting from the advanced SDN technology concept, the SDN technology was innovantly applied to the centralized collection, free networking and unified distribution of bypass traffic data, and the advanced NP+ASIC chip solution was combined to realize the identification, classification control and distribution of traffic data content based on content. Finally, a set of Matrix-SDN traffic data control platform "oriented to traffic data" is formed, which provides a perfect solution for the bypass traffic data management of enterprises, and provides new guidance and direction for the management of future traffic data requirements.
New capability of "traffic data networking"
Taking SDN technology as the core and the advanced architecture of separating the "control plane" and "data plane" as the guiding ideology, the traditional traffic collection hardware is SDNized, which provides flexible networking capabilities for the unified collection and distribution of traffic data.
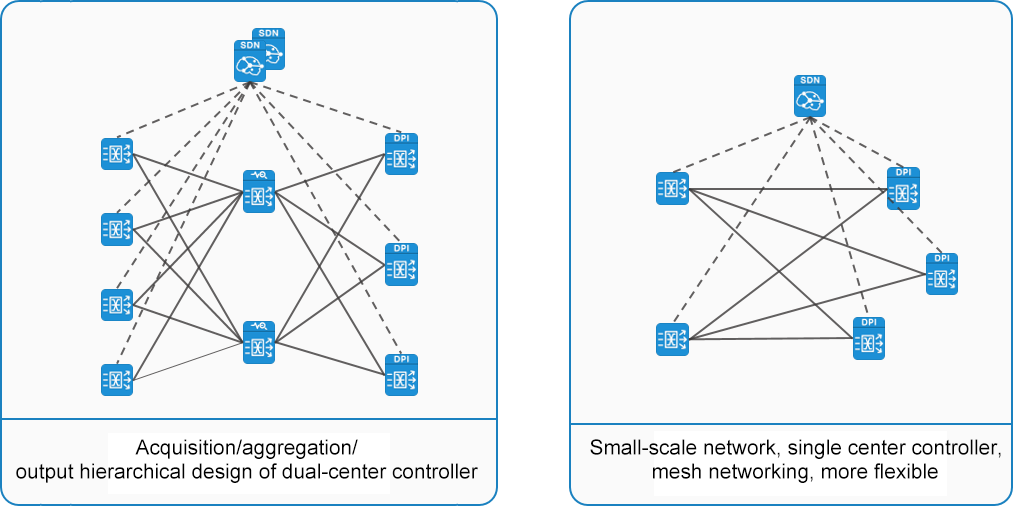
With the support of SDN technology, traffic data network can support a variety of flexible networking topologies such as mesh, CLOS, and semi-mesh, which can perfectly adapt to the networking support of bypass traffic data of different scales.
Intelligent routing, higher reliability, easier management - Based on the centralized SDN controller, the standard OpenFlow/Netconf interaction protocol, the central SDN controller has a complete global grasp of all links, devices, ports in the traffic collection network information, based on the user configuration policy requirements intelligent decomposition into hop-by-hop flow table. And it can automatically update according to the topology state of the collection network in real time, completely shield the complex routing process for users, and users no longer need to pay attention to the internal routing strategy to simplify user management and improve the reliability of the traffic data collection network.
Introduction of advanced routing features such as CLAG/ECMP:
Controller HA high availability support - As the basic platform of the whole network traffic data center, the controller supports the high reliability and redundancy of HA master and backup, which further ensures the reliability and stability of the traffic data platform.
Strong scalability - The networking based on SDN architecture supports different scales of networking, so that the traffic collection network can be smoothly expanded with the growth of the scale of the enterprise IT network. The expansion only needs to add the corresponding data management unit to access more traffic collection points, and realizes the unified management of the whole network traffic.
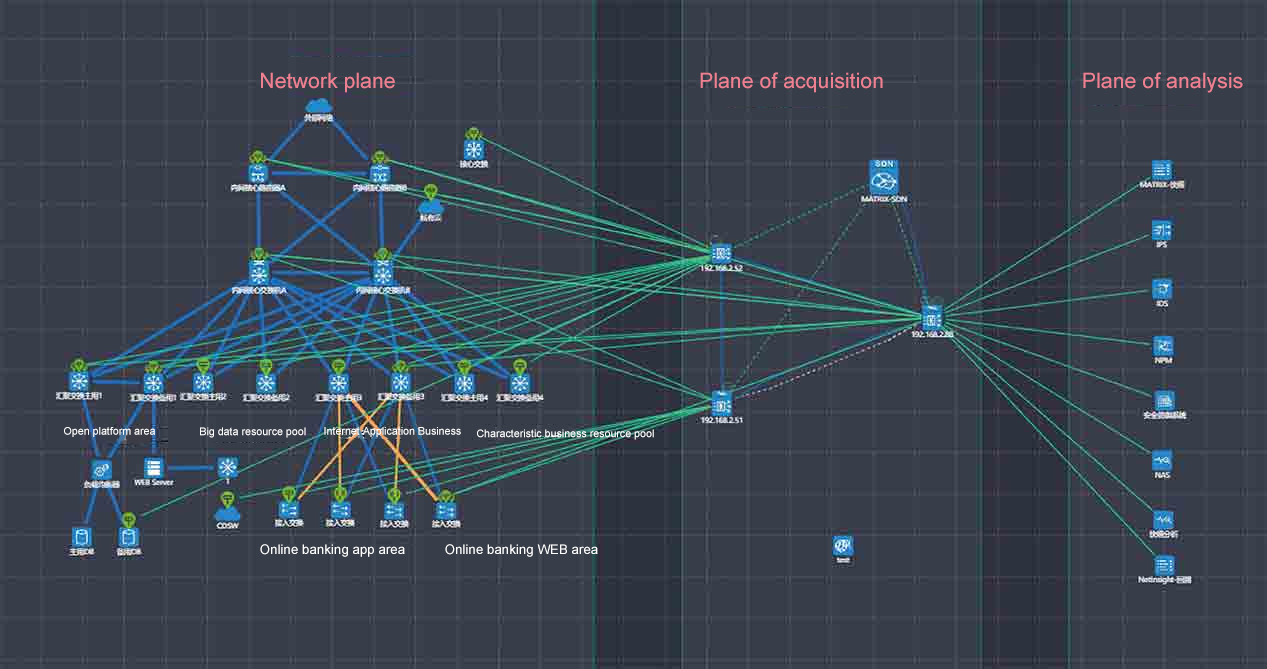
New "Data source/target visualization" capability
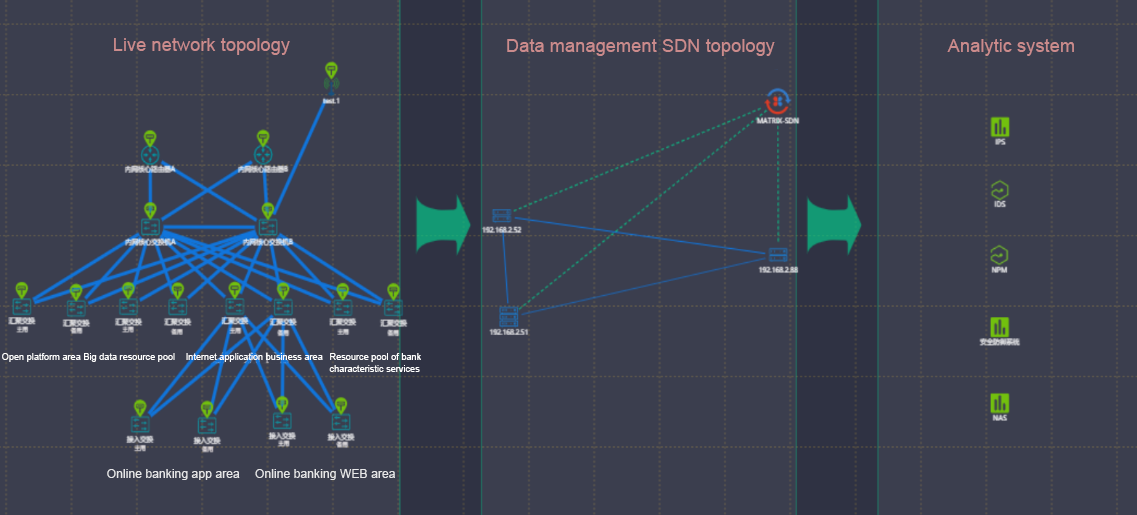
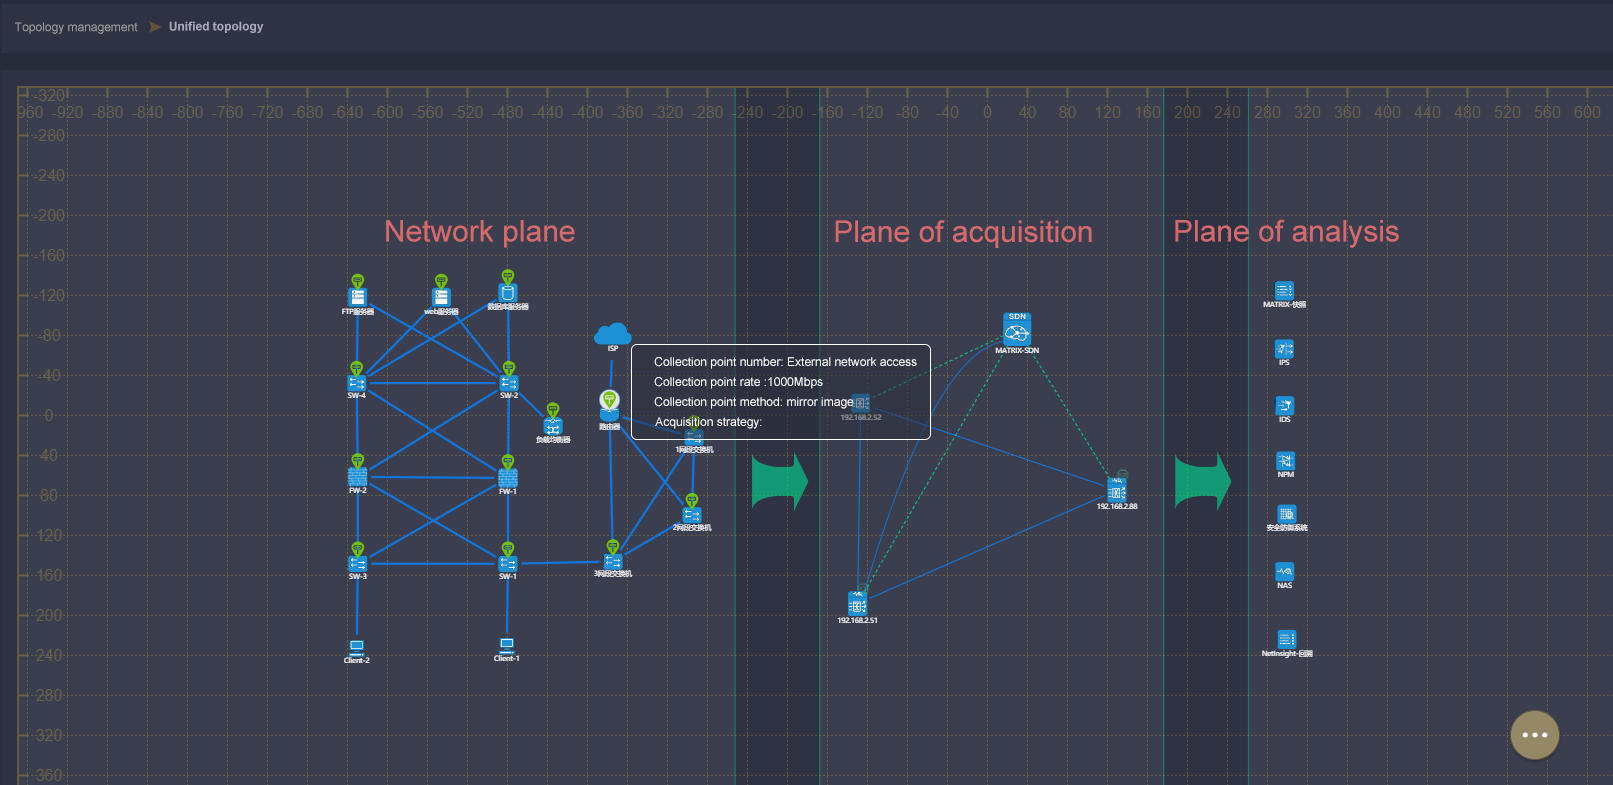
Benefiting from the computing power of the centralized controller of SDN technology, the matrix-sdn management platform realizes an integrated topology view for user network topology, collecting plane topology and analyzing plane topology, and realizes an interconnected centralized integrated display of the interconnection between three plane topologies. Managers facing the complex traffic collection sources and traffic output logical relationship can realize the perfect visual view display and management in the platform, which greatly reduces the workload of managers.
New "Data-oriented" capabilities
Based on the perfect combination of advanced SDN technology and ASIC/NP hardware architecture processing technology, matrix-sdn platform leads the industry trend, abandons the traditional idea of "device management oriented", and realizes the centralized control of traffic data "data management oriented".

Based on the new ability of "data-oriented management", users can realize more refined and flexible data delivery based on different content classification of network traffic data, which builds a solid foundation for network information security analysis /IT operation and maintenance analysis. It reduces the risk of traffic data leakage and improves data security.
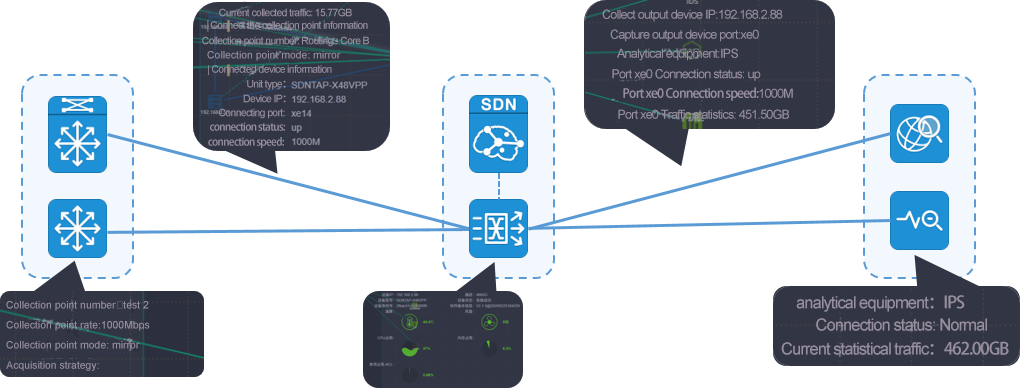
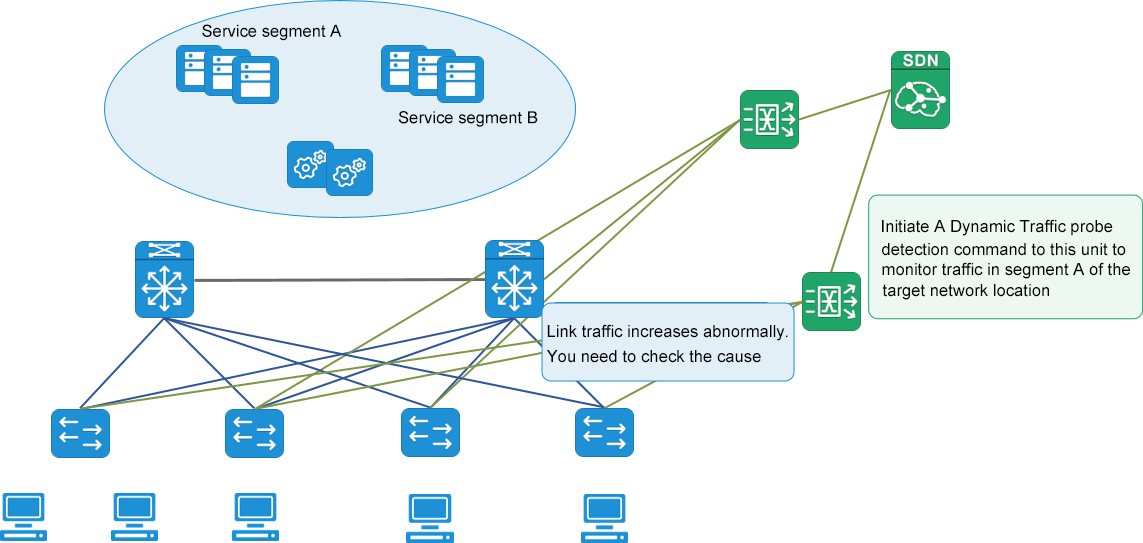
New capability for "dynamic traffic data acquisition"
Based on the scientific and comprehensive MATRIX-SDN traffic data collection network, dynamic data detection is performed on any covered collection point position, and whether there is a fault communication endpoint or not communication behavior is directly detected to eliminate the problem of incorrect client configuration. Multiple nodes simultaneously detect the bidirectional communication behavior of the specified communication endpoint to further locate the network/security device policy configuration problem. The data filtering function based on tuples is based on the flexible data probing hand provided by MATRIX-SDN, so that the operation and maintenance personnel can obtain the original data they want to analyze anytime and anywhere. Direct the most effective and efficient means of locating and resolving faults. It makes the complex and difficult fault location and elimination become efficient and simple.
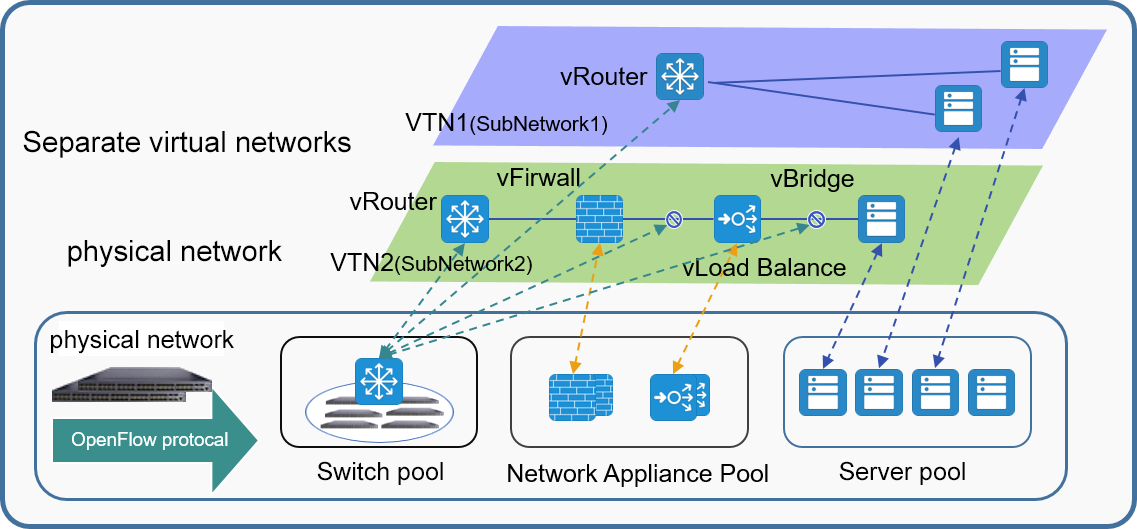
New ability of "combination of virtual and real, integrated cloud acquisition"
Combined with MATRIX-SDN traffic data collection network, Vtap traffic collection software is deployed to collect east-west packets between virtual machines in Vmware, OpenStack and Hyper-V environment. Through Vtap software, it can realize the collection of packets between virtual machines that cannot be collected by traditional methods. It solves the difficulty of obtaining virtualization/cloud network traffic data, and realizes the centralized control of traffic data with "full coverage of east-west traffic".
Based on the new ability of "combination of virtual and real, integrated cloud acquisition", it fully solves a large number of applications in data center virtualization/cloud network. The data interaction between virtual servers may only be reflected in the memory data exchange within the same server, and it is difficult to obtain virtualization/cloud network traffic data. So as to realize the comprehensive coverage and collection of traffic data in a complete sense, unified centralized control, and traffic data visualization.
Matrix-SDN opens a new era of "traffic data management"
The integration of advanced SDN technology and advanced NP+ASIC chips to build a scientific traffic data acquisition network, in response to the growing demand for traffic data, increasingly complex traffic data location, content management needs, using the "traffic data oriented" design, everything from the "traffic data" itself, The traffic data of the physical network and the cloud network in the enterprise network are collected in all aspects to achieve comprehensive coverage of traffic data and eliminate monitoring blind spots. Moreover, the traffic data is sorted out based on the business data type, and the data sensitivity characteristics, business interaction characteristics and protocol characteristics of different business interaction data flows have good aggregation. In order to reduce the security risk of traffic data and improve the security of traffic data, it establishes different classification flow data for different business systems, manages and controls the distribution of traffic data with different classification, and provides traffic data to different traffic data analysis tools based on the principle of "minimizing data rights". It realizes a unified display of the logical topology architecture of the current network, clearly shows the logical location and collection method of the traffic data collection point, and shows the topology architecture of the traffic collection network itself, and monitors and manages the working status of the collection unit and the traffic distribution status in real time. So as to achieve the logical topology of the traffic source, processing process and destination visualization. Clearly show the traffic collection location, processing strategy, input and output information, so that the control strategy of traffic data is changed from complex to simple. It realizes dynamic acquisition of traffic data, provides flexible data detection hand and convenient data detection function, performs dynamic data detection on any covered collection point location, directly detects traffic data information of communication endpoints, and allows operation and maintenance personnel to obtain the original data they want to analyze at any time and anywhere. It is a powerful security operation and maintenance support tool. Direct the most effective and efficient means of locating and resolving faults. Consolidate the foundation of traffic data to truly support the operation and maintenance/security business needs of IT systems.
In the typical application scenario of NPB, the most headache for administrators is the problem of packet loss caused by image packets and NPB network congestion. NPB packet loss typically causes backend analytics tools to do the following:
• The decrease of APM service performance monitoring indicators generates alarms and reduces the success rate of transactions
• NPM network performance monitoring generates metrics exception alerts
• Security monitoring systems generate false negatives and fail to detect cyber attacks
• The business audit system generates a loss of business behavior audit events
...
As a centralized collection and distribution system for bypass monitoring, the importance of NPB is self-evident. At the same time, the way it handles data packet traffic is different from the traditional network switch, and the traffic congestion control technology of many business network is not applicable to NPB. How to solve NPB packet loss, let's start with the root cause of packet loss analysis to see!
Root Cause Analysis of NPB/TAP packet Loss congestion
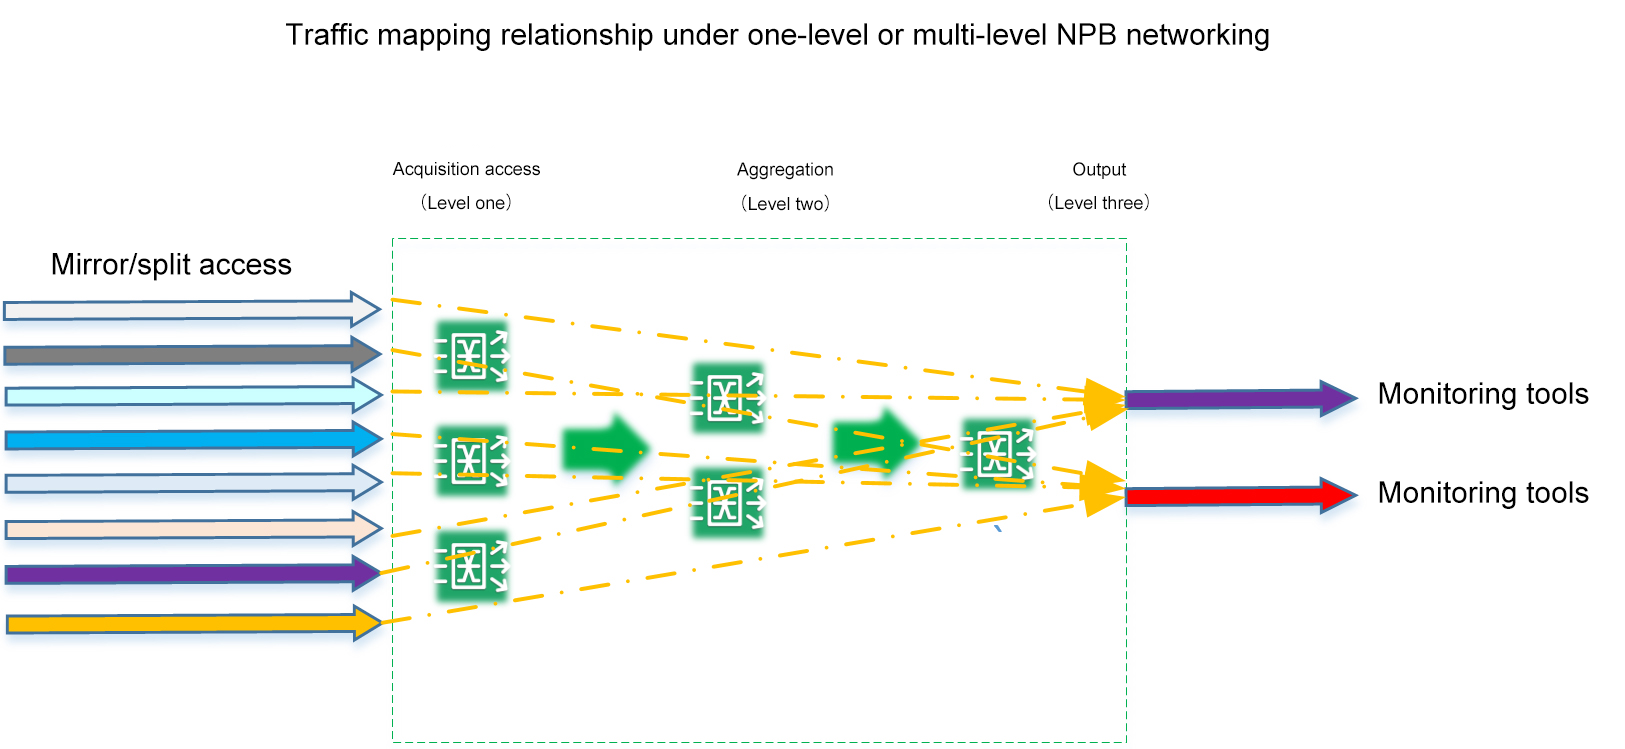
First, we analyze the actual traffic path and system access mapping relationship under the next level or multi-level NPB networking. No matter what kind of network topology NPB forms, in the end, as a collection system, there is a many-to-many traffic input and output relationship between "access" and "output" of the whole system.
Then we look at NPB's business model from the perspective of an ASIC chip on a single device:
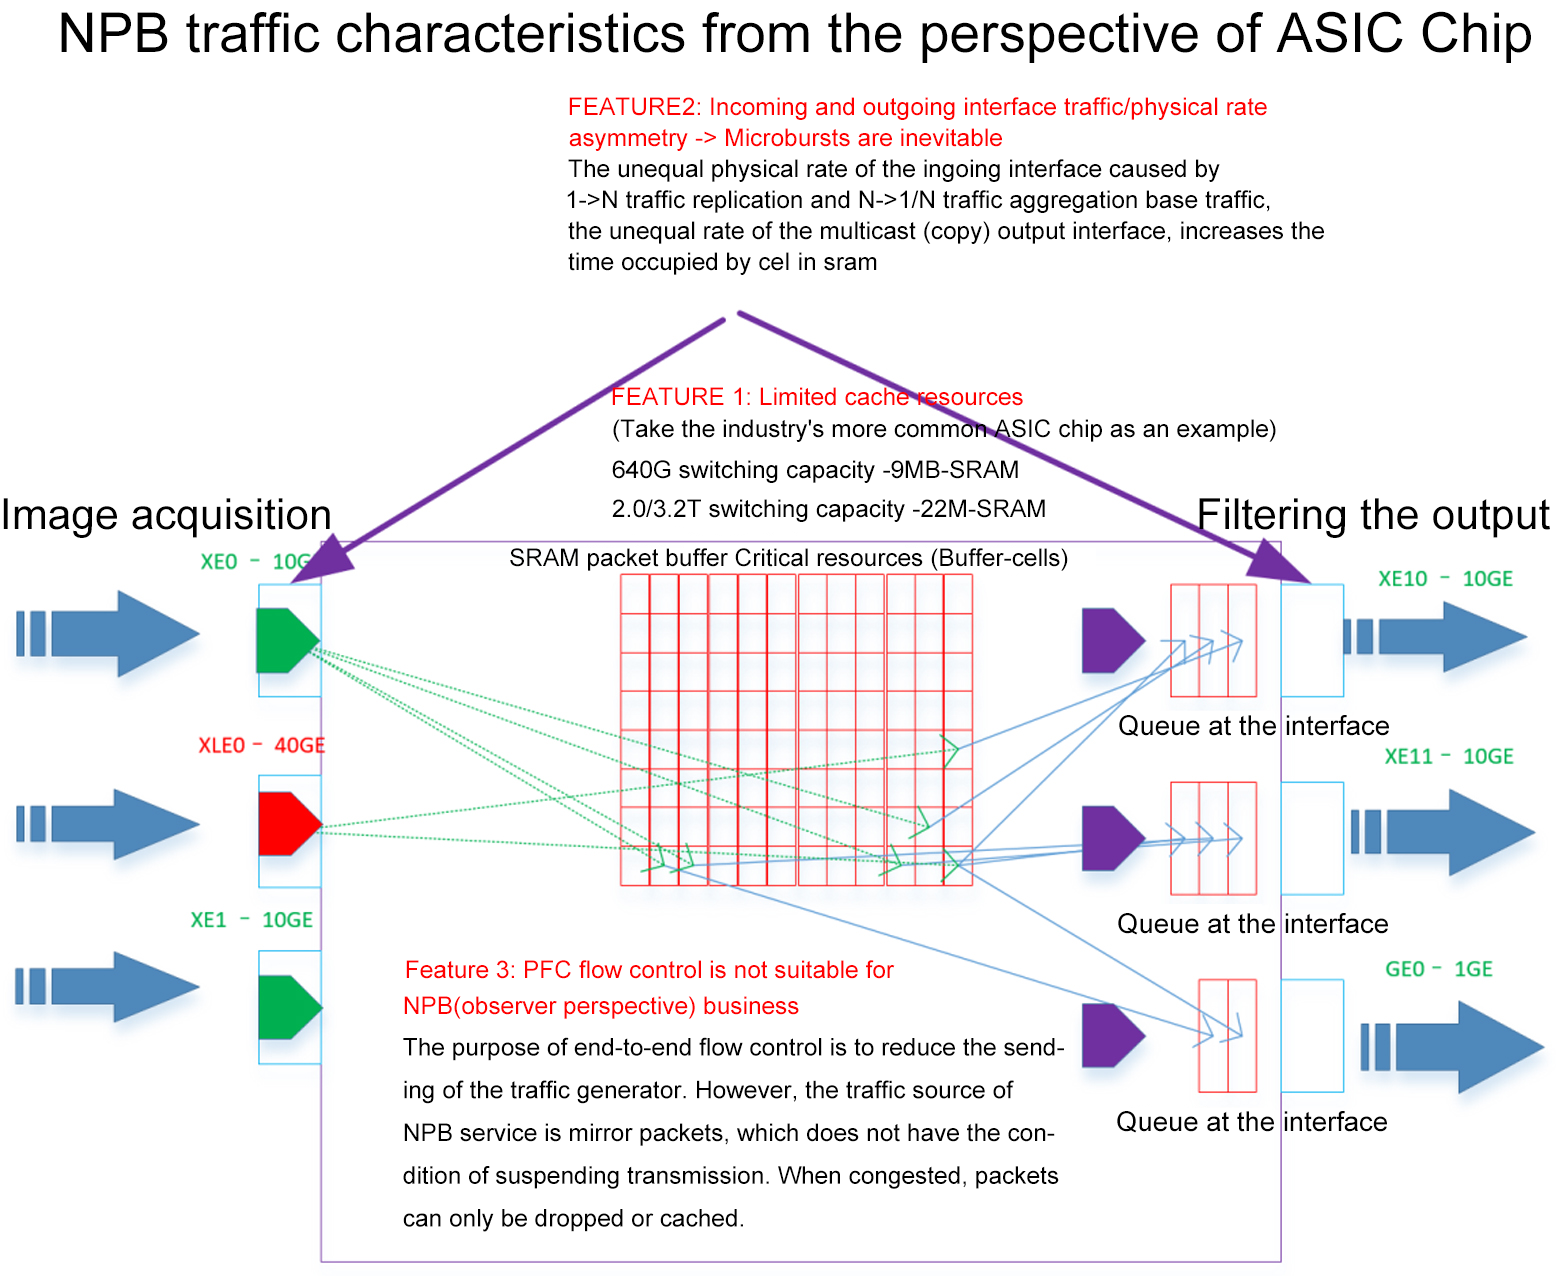
Feature 1: The input and output interface "traffic" and "physical interface rate" are asymmetric, and a large number of micro bursts are generated as an inevitable result. In typical many-to-one and many-to-many traffic aggregation scenarios, the physical rate of the output interface is often less than the physical sum of the input interfaces. For example, 10 channels of 10G acquisition, 1 channel of 10G output; In the case of multilevel deployment, all NPB can be viewed as a whole.
Feature 2: ASIC chip cache resources are very limited. In the current commonly used ASIC chip, 640Gbps switch capacity chip caches 3-10Mbytes; Chips with 3.2Tbps capacity are cached in 20-50Mbytes. ASIC chips from BroadCom, Barefoot, CTC, Marvell and other manufacturers are included.
Feature 3: The conventional PFC end-to-end flow control mechanism is not suitable for NPB services. The core of PFC flow control mechanism is to achieve end-to-end traffic suppression feedback, and finally the protocol stack at the communication endpoint reduces the transmission of packets to alleviate congestion. However, the source of NPB service is mirror packets, so the congestion handling strategy can only be discarded or cached.
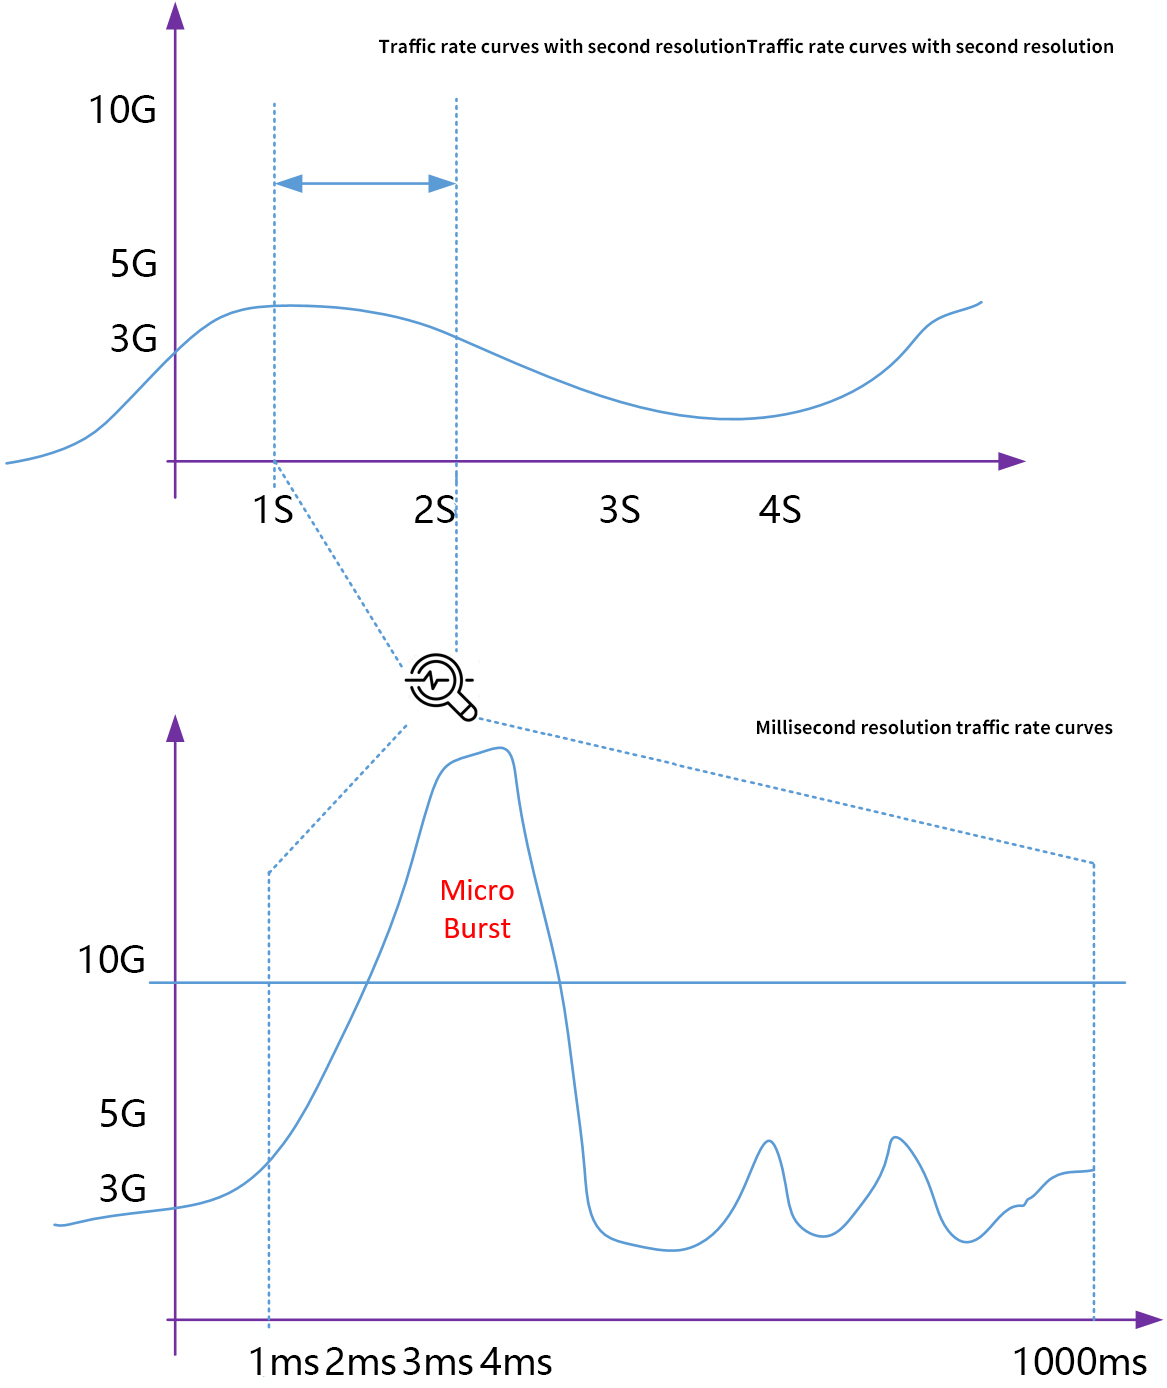
Here's what a typical microburst looks like on the traffic curve:
Taking the 10G interface as an example, in the second level traffic trend analysis diagram, the traffic rate maintained at about 3Gbps for a long time. In the micro-millisecond trend analysis chart, the MicroBurst has greatly exceeded the physical rate of 10G interface.
Key technologies to alleviate NPB micro-burst
Reduce the differential impact of physical interface rate mismatch - When designing a network, users should minimize the asymmetric input and output physical interface rates as much as possible. A typical means is to use higher rate uplink interface links, and try to avoid asymmetry in the physical rate of traffic output interfaces (e.g., 1G and 10G traffic output at the same time).
Optimizing system buffer management strategy for NPB service - The common system buffer management strategy for switching service is not suitable for NPB forwarding service. The buffer management strategy of "static guarantee" + "dynamic share" should be implemented according to the characteristics of NPB service. In order to minimize the impact of NPB micro-burst under the limitation of current chip hardware environment.
Implement classified traffic engineering management-implement priority traffic engineering service classification management based on traffic classification, guarantee the quality of service of different priority queues based on classified queue bandwidth, and ensure that users' highly sensitive traffic packets can be transmitted with zero packet loss.
Enhance the ability of packet caching and traffic shaping with a reasonable system scheme. Through the integration of a variety of technical means, the packet caching ability of ASIC chip is expanded. By implementing traffic shaping at different locations, micro-bursts are transformed into micro-uniform traffic curves after shaping.
NetTAP microburst traffic management scheme
Scheme 1 - network-wide optimized buffer management strategy + network-wide classified qos priority management
Network-wide optimized cache management strategy
Based on the in-depth understanding of NPB service characteristics and the practical business scenarios of a large number of customers, NetTAP traffic collection products implement a set of "static guarantee + dynamic sharing" networkwide NPB buffer management strategy, which has a good effect on traffic buffer management in the case of a large number of asymmetric input and output interfaces. Under the condition of fixed buffer of current ASIC chip, micro-burst tolerance is achieved to the maximum extent.
Microburst Processing Technique-management based on service priority
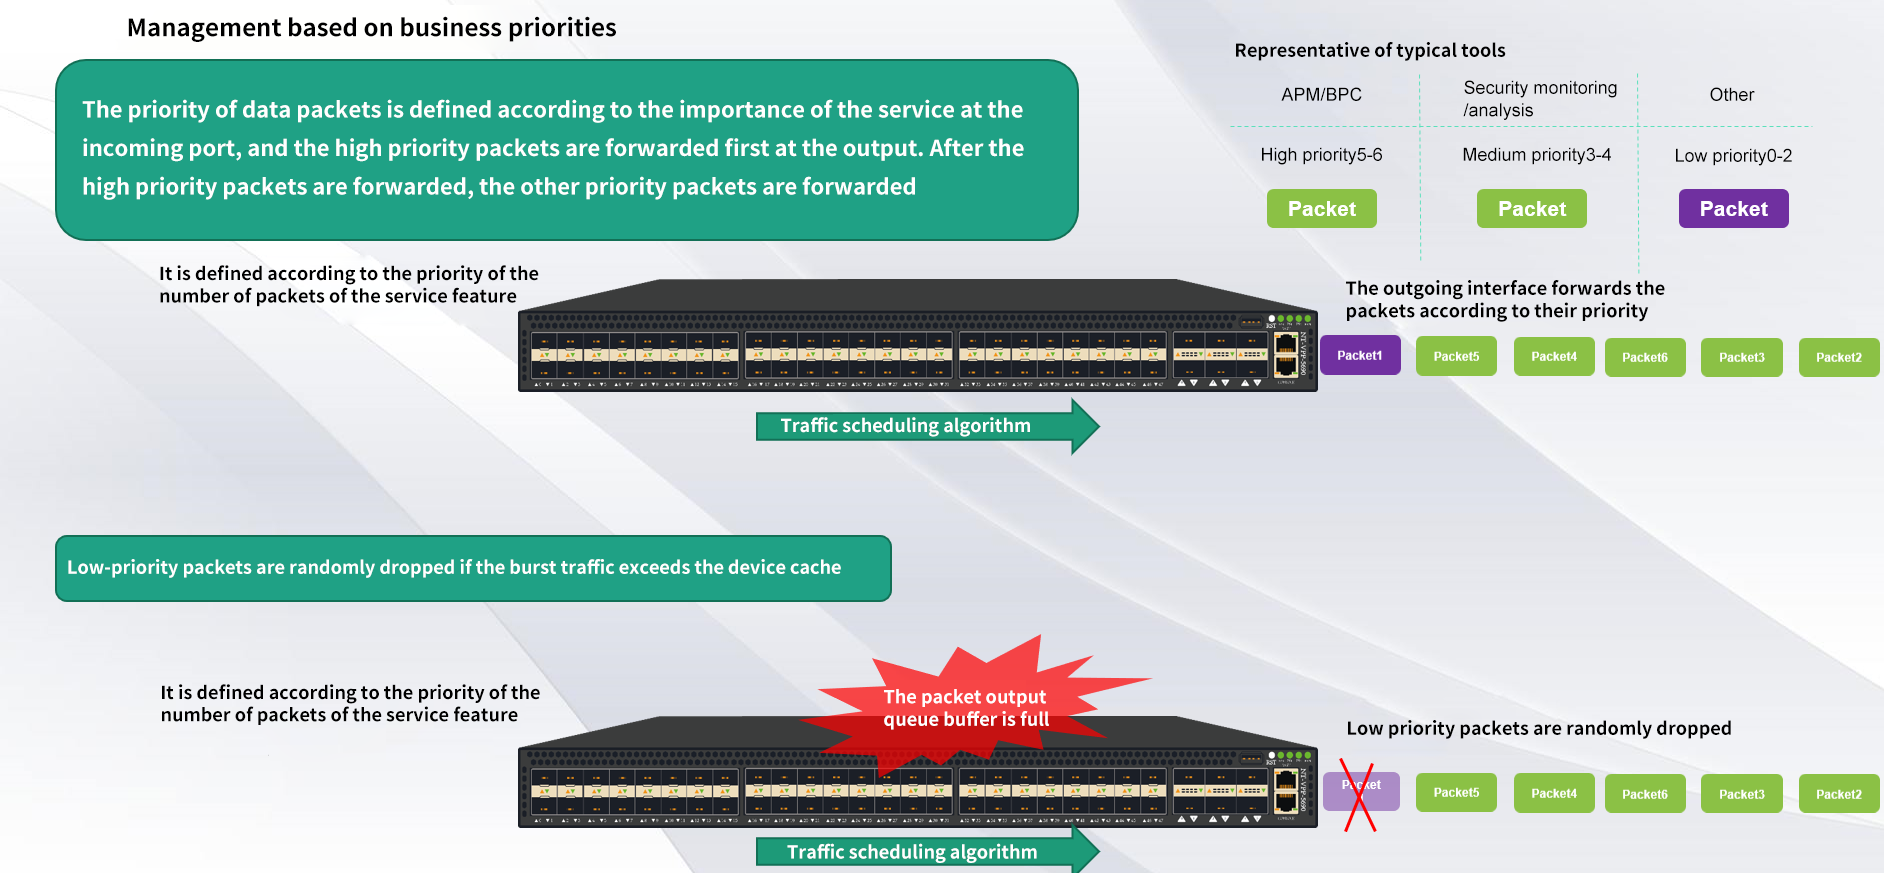
When the traffic collection unit is deployed independently, it can also be prioritized according to the importance of back-end analysis tools or the importance of business data itself. For example, APM/BPC among many analysis tools has higher priority than security analysis/security monitoring tools because it is involved in the monitoring and analysis of various indicators of important business systems. Therefore, for this scenario, the data required by APM/BPC can be defined as high priority, the data required by security monitoring/security analysis tools can be defined as medium priority, and the data required by other analysis tools can be defined as low priority. When the collected data packets enter the input port, the priority is defined according to the importance, the high priority packets are forwarded first at the output, and the other priority packets are forwarded after the high priority packets are forwarded. If the high priority packets continue to arrive, the high priority packets are forwarded first. If the duration is long and the input data exceeds the forwarding capacity of the output port, the excess data can be stored in the device cache. If the device cache is full, the lower priority packets will be preferentially discarded. Through this priority management mechanism, it can always ensure that the important analysis tools can obtain the original traffic data needed for analysis in real time and efficiently.
Micro-burst processing Techniques-classification guarantee mechanism of whole network qos
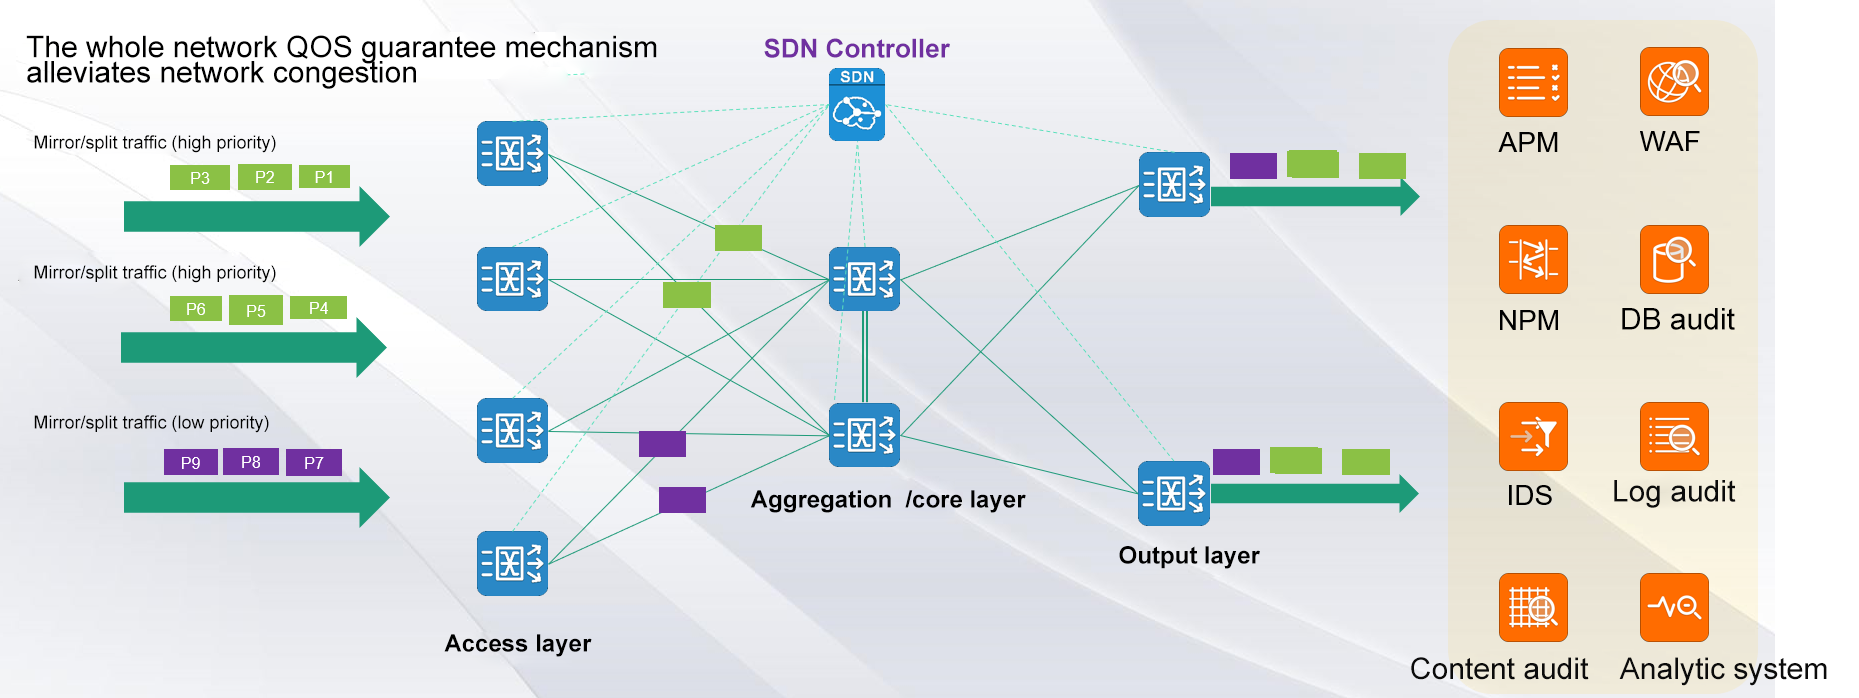
As shown in the above figure, on all the devices participating in the networking of the access layer, the convergence/core layer and the output layer, the flow classification technology is used to distinguish different services, and the priority of the collected packets is re-marked. The SDN controller is used to centrally issue the traffic priority policy and apply it to the forwarding device. All devices participating in the network are mapped to different priority queues according to the priority carried by the packets. This can effectively ensure that the high priority packets with small traffic achieve zero packet loss. It effectively solves the packet loss problem of APM monitoring and special service audit bypass traffic services
Scheme 2 - GB level extended system cache + traffic shaping scheme
Gigabyte level system expansion cache
When our traffic collection unit equipment has advanced functional processing capabilities, it can open up a certain amount of space in the internal memory (RAM) of the device as the global Buffer of the device, which greatly improves the Buffer capacity of the device. For a single acquisition device, it can provide at least GB capacity as the cache space of the acquisition device. This technology makes the Buffer capacity of our traffic acquisition unit device hundreds of times higher than that of the traditional acquisition device. At the same forwarding rate, the maximum duration of micro-burst that our traffic acquisition unit device can withstand becomes longer. The microburst time supported by traditional acquisition devices is increased by thousands of times from milliseconds to seconds.
Multi-queue traffic shaping capability
Micro-burst processing technology - A solution based on large capacity Buffer buffer and traffic shaping
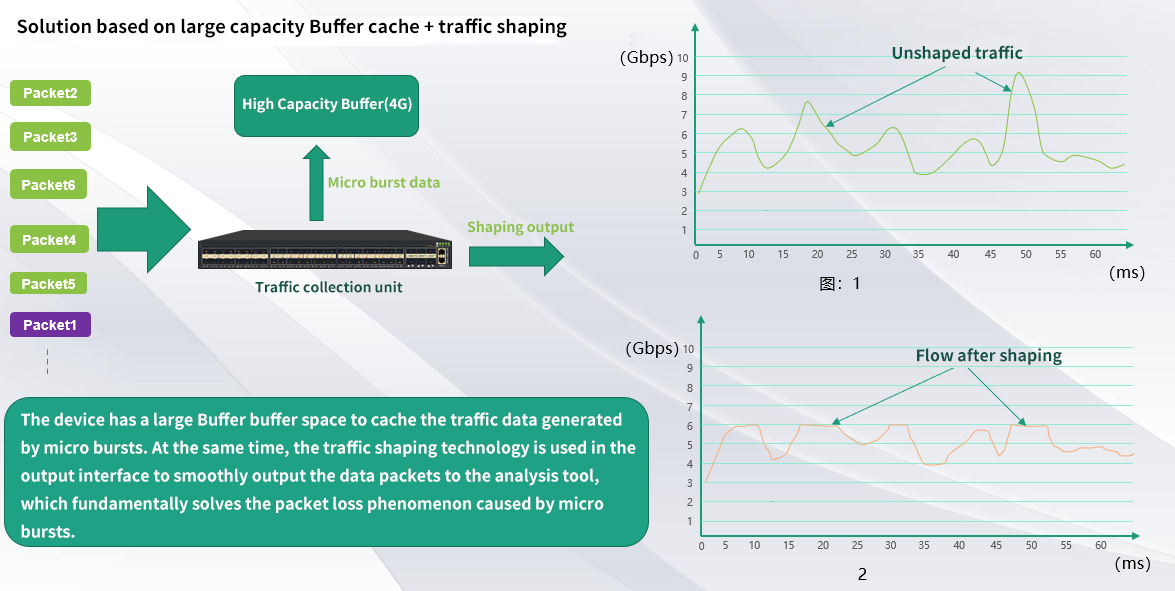
At the same time, the traffic shaping technology is used in the output interface to realize the smooth output of data packets to the analysis tool. Through the application of this technology, the packet loss phenomenon caused by micro-burst is fundamentally solved.
Fast delivery of traffic data
In the IT network security/operation and maintenance management, when the network security/operation and maintenance analysis equipment is online, we need the traffic demand of certain IP segments of the network location, we security \ operation and maintenance engineers are more painful.
More and more complex traffic data analysis devices can be brought online quickly!
Matrix-SDN should deliver traffic data quickly
The advanced networking technology transformed the traditional traffic collection hardware into SDN, which provided flexible networking capabilities for unified traffic data collection and distribution. It can support mesh, CLOS, half mesh and other flexible networking, and can perfectly adapt to different scales of bypass traffic data networking.
On-demand traffic data delivery, after planning the collection nodes and collecting traffic through the distributed traffic collection unit, the output of traffic can be very flexible and automatic, based on the MATRIX-SDN traffic data collection network.
(1) Aggregation output one or more network locations collect traffic output.
(2) Output traffic from one or more network locations to a cell/port.
(3) The traffic policy is output to different cells/ports based on the traffic data type.
Source visibility of acquisition location for Matrix-SDN platform
(2) Intelligent recalculation of intermediate redundant paths, intelligent switching routing when link state changes, and real-time visualization of switching paths.
In short, the collection and distribution strategy of Matrix-SDN platform can be achieved: path visual, detail visual, and state visual.
In short, the collection and distribution strategy of Matrix-SDN platform can be achieved: path visual, detail visual, and state visual.
One policy for traffic traversal, no more back-and-forth configuration!
Hop-by-hop traffic through the details of the complete visual, to meet the technical details of the control needs!
Is the policy hitting traffic?
Is there any output interface traffic?
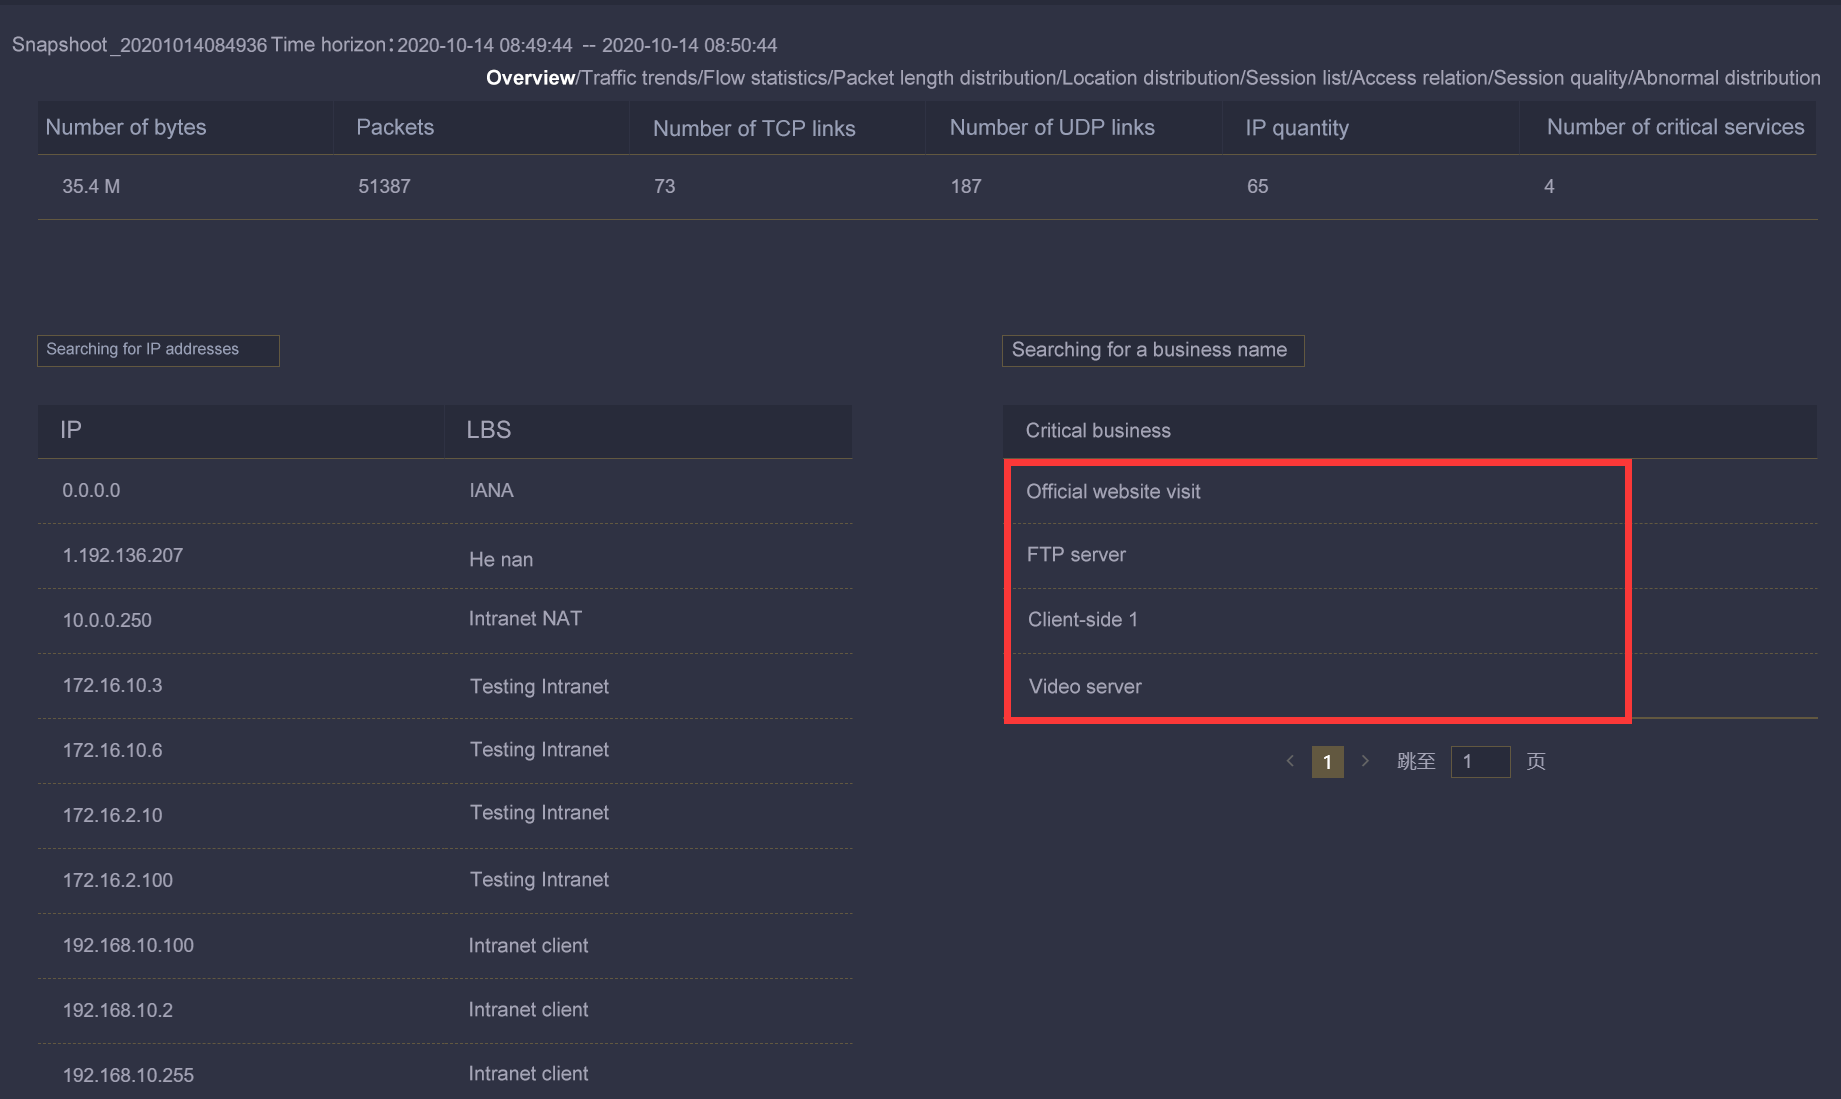
Content visual - Verify correct traffic:
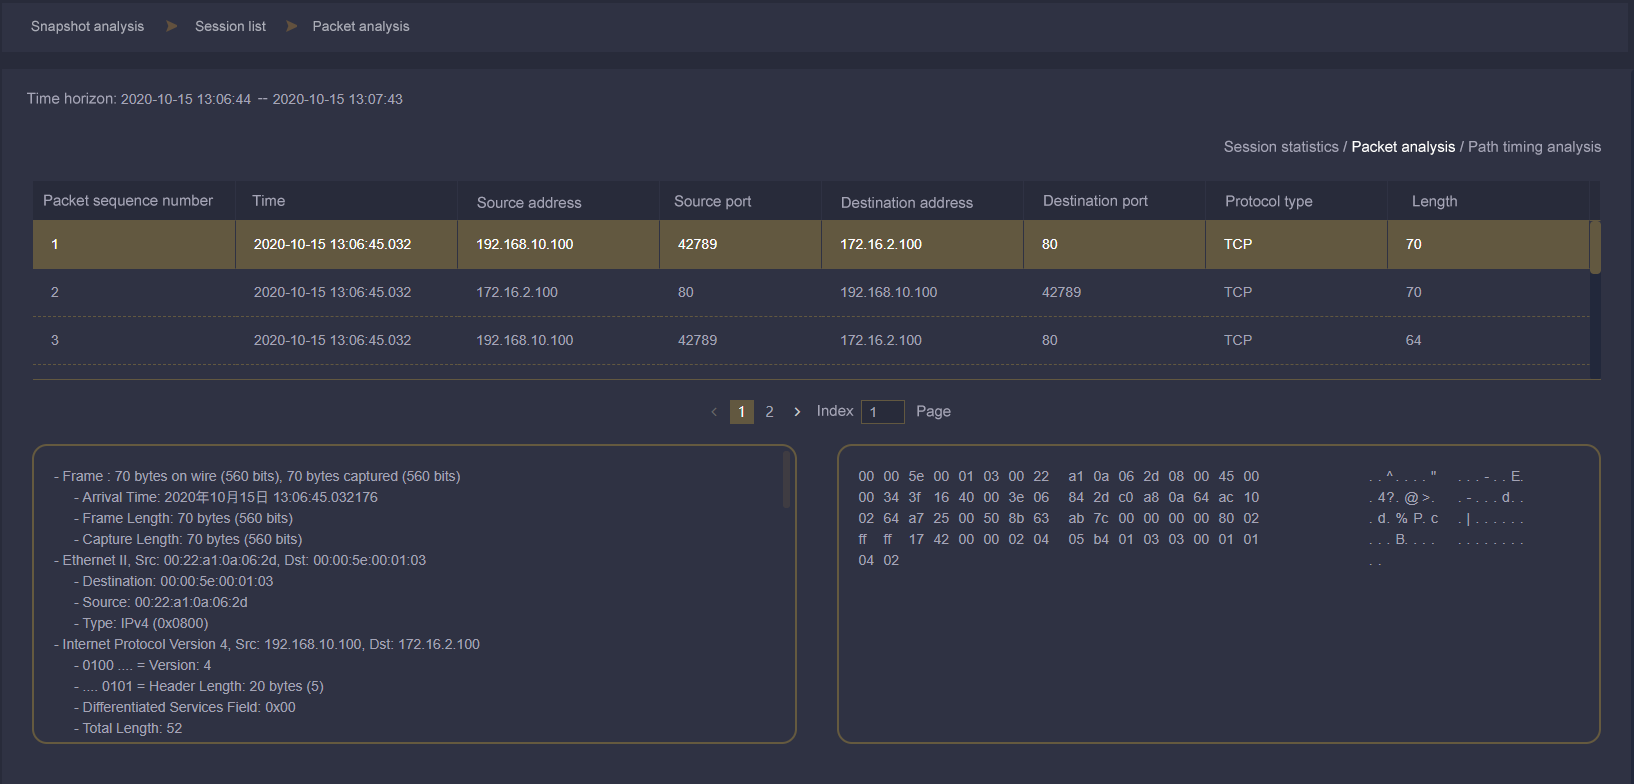
Through the efficient operation and maintenance tool "traffic snapshot technology" built into the MATRIX-SDN platform, real-time packet capture and real-time depth content analysis of traffic at any location covered by the whole network can be realized, and the content can be visualized to solve the problem of "data content confirmation" in the process of traffic delivery.
Challenges in fast delivery of traffic data
In the enterprise IT network security/operation and maintenance management, network security/operation and maintenance managers like me often encounter the pressure and challenge of rapid delivery of traffic data.
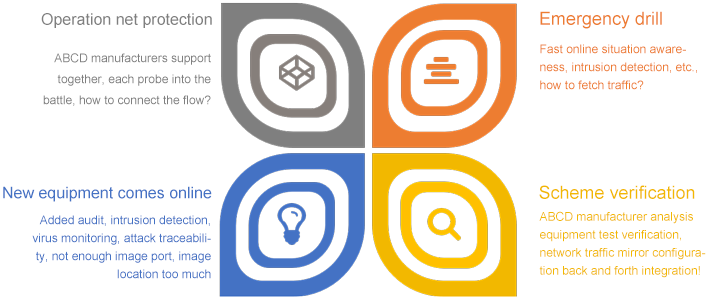
Traffic data should be delivered quickly in a regular way
In the enterprise IT network security/operation and maintenance management, when network protection action, emergency drill, scheme verification, new equipment online, these specific scenarios require rapid traffic data management and distribution requirements, and in the traffic scenarios that require key IP segments of a certain network location, security/operation and maintenance engineers need to go back and forth through the traditional TAP implementation method.
Said so many troubles and headaches, until I found a solution, here is what I will introduce to you "good tools"!
Various "intrusion detection", "special audit", "situation awareness", "attack traceability", "virus monitoring", "APT attack detection", "NPM", "APM" and "big data analysis" can ensure that the traffic data is obtained and delivered quickly and accurately!
The traffic collection network of Matrix-SDN platform realizes intelligent collection/data delivery
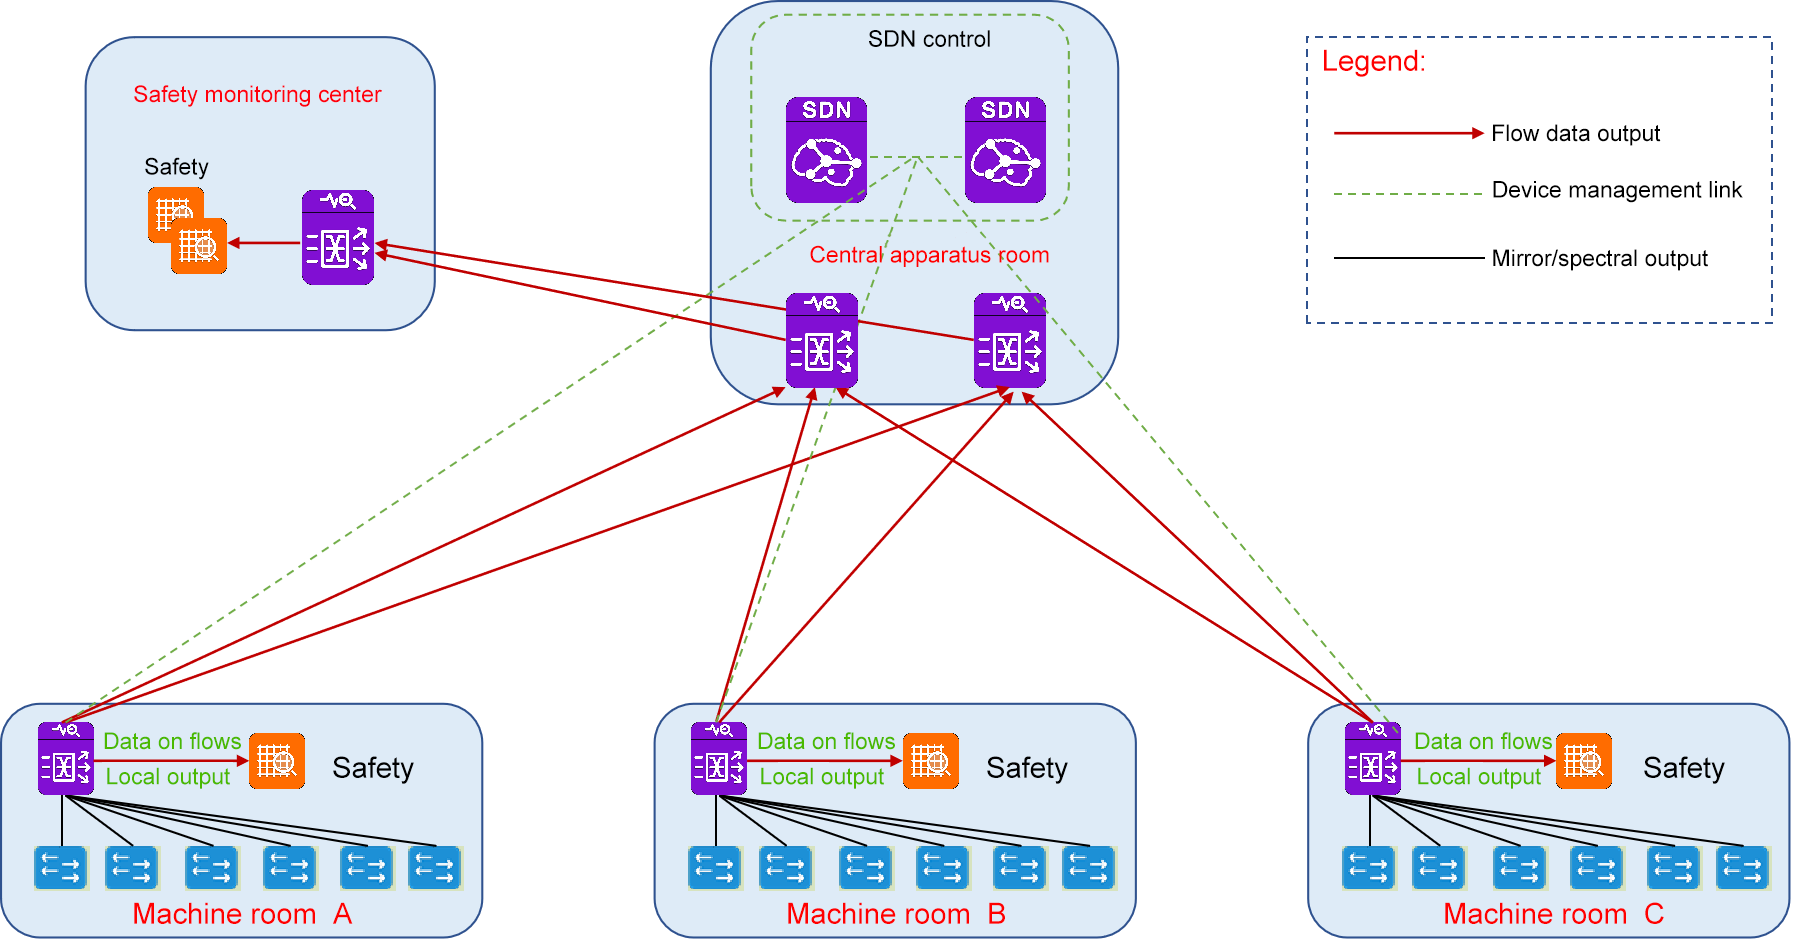
Network data collection, MATRIX-SDN traffic data collection network will disperse optical and electrical links and online optical splitting, bypass mirroring, virtual TAP in cloud computing/virtualization environment and other ways for centralized, network-wide traffic data collection, to achieve the full original traffic data capture of the user's current network.
The MATRIX-SDN management platform realizes an integrated topology view for user network plane topology, collection plane topology and analysis plane topology, which can easily grasp the source location of traffic data and the collection method of traffic data (mirror/spectrophotole /TAP). In the face of new traffic data delivery requirements, users can quickly find the source location of traffic data [collection point].
Visibility of acquisition and distribution policy for Matrix-SDN platform
(1) It only needs to pay attention to the input/output of traffic, and the intermediate path is automatically calculated, which simplifies user configuration and improves work efficiency.
Matrix-SDN platform gives visibility to traffic data trends & content
Trend visualization - Verify traffic size:
After the traffic data is delivered and distributed, directly click the links of "any collection point", "output target" and "policy object" in the policy element, and the traffic trend status of the corresponding object can be displayed immediately.

Simple and direct "traffic delivery strategy integration" user interaction UI design, one interface can be quickly checked and verified to improve user efficiency:
Is the source flow of the collection point normal?
Fast traffic data delivery - Improve the efficiency of traffic data management
The MATRIX-SDN traffic data security control platform focuses on fast traffic data delivery from the perspective of "traffic data location and source visual", "traffic data content visual", "traffic data strategy visual" and "traffic data trend effect visual" to solve the actual pain point of "slow traffic data delivery" of front-line traffic data operation and maintenance personnel. Improve the efficiency of traffic data delivery and management, and reduce operation and maintenance costs.
In recent years, with the rise of artificial intelligence, cloud computing, 5G and other technologies, the visualization of traffic data in the field of information security and IT operation and maintenance has become indispensable. No matter security operation, threat intelligence, situation awareness, all need to rely on traffic data for analysis and operation and maintenance. Thus helping technicians to conduct more efficient and intelligent analysis. Network traffic data visualization simply means cameras in the network to supervise, analyze and mine the source/destination of network traffic. Using the human visual perception system, the network data is displayed in a graphical way, and the network data can be explained and summarized quickly and intuitively. On the one hand, it can assist users to understand the internal structure of the network, and on the other hand, it is helpful to mine the valuable information hidden in the network.

The traditional way to control traffic data
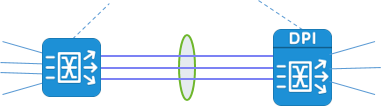
In order to analyze the network traffic, it is necessary to collect the network traffic first. In order not to interfere with the production network, we need to deploy an additional data collection network in addition to the production network. The data acquisition network replicates the production traffic through the splitter and SPAN(port mirror) on the switches and routers, and imports the traffic into the corresponding traffic analysis/monitoring tools for analysis and monitoring.
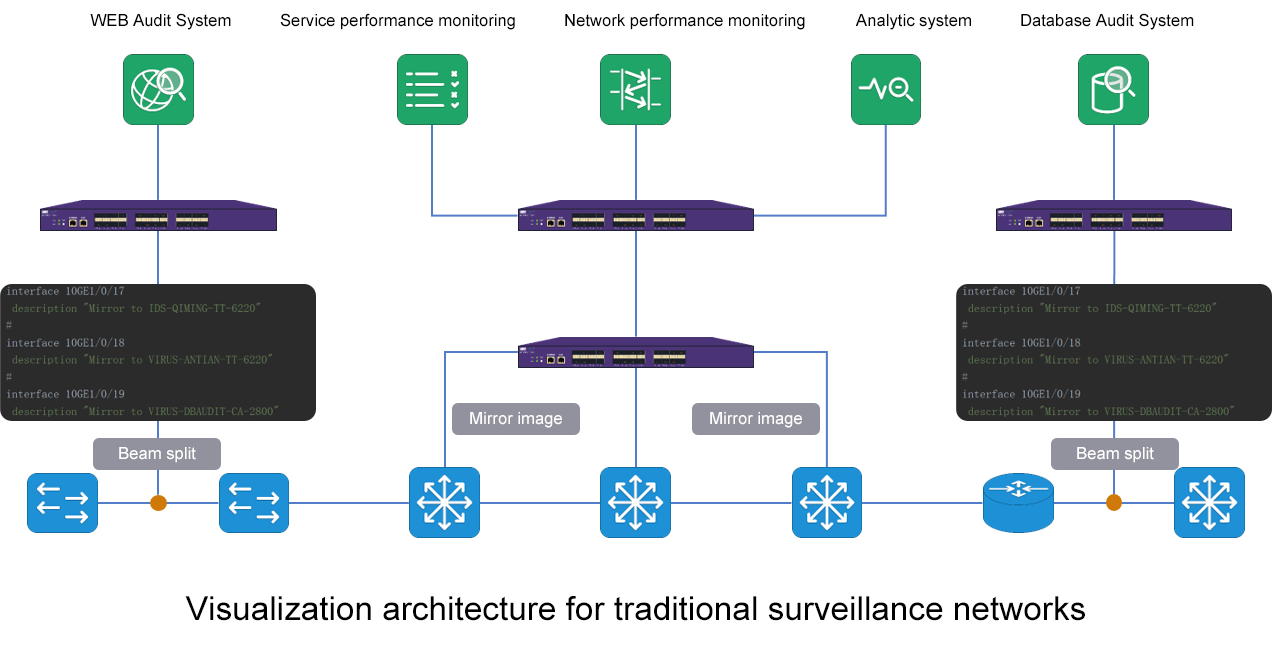
But the traditional monitoring network architecture also has many defects. Its high price makes it difficult to gain popularity in some budget-constrained user environments. At the same time, due to its closed nature, it is difficult for taps to connect with each other to form islands of taps and tools, and it is also difficult to meet the requirements of large-scale networking and centralized
Visualization management in modern data centers:
-Tap and analysis tools are deployed dispersed. Users cannot fully grasp the network topology visualization architecture. Causing confusion in traffic data management
-The traffic distribution policy is configured through the background command line, and the cascade between TAP devices needs to be configured hop by hop. Time-consuming and laborious;
-The traffic distribution policy needs to be viewed through the background command line (display & show), which is difficult to form a visual and intuitive view.
-The trend information of the traffic at the collection point cannot be verified by visual means, so it is checked back and forth when determining the input information.
When Network Traffic Visual Control meets it (MATRIX-SDN)
MATRIX-SDN platform based on SDN technology, the traffic data visualization control platform realizes the visual collection and presentation of traffic data and the visualization of traffic data management and control strategy:
-Visualization of the network Triad topology
-Traffic distribution strategy facilitates real-time viewing visualization
-Visualization of real-time viewing of traffic at the collection point
-Visualization of the traffic distribution policy
Visualization of the Triad topology
Visualization of the traffic distribution policy
- Flow collection, flow distribution, and flow data monitoring strategies are uniformly decomposed into flow tables and sent to each acquisition equipment unit.
- Take the user's current network environment as a view, so that customers know the context of the traffic;
- Take the user's business data as a view, and let the customer define its data distribution strategy based on the data type.

Traffic distribution policies facilitate viewing visualizations
- Users do not need to pay attention to the specific transmission path of traffic data in the SDN network of the collection unit, but only need to pay attention to the data source and distribution target on the demand side.
- Clearly see the source of traffic collection, the distribution path of traffic, and the output target of traffic. Realize the visual display of traffic data source/destination.
- The separation of traffic policy control and execution was realized, and the centralized configuration/distribution/dynamic synchronization of all traffic policies was completed.

Visualization of real-time viewing of traffic at the collection point
- Real-time monitoring of traffic summary at different locations through visual charts, including traffic size, packet length distribution, link utilization, bandwidth and other real-time information, so as to confirm traffic data input information intuitively and conveniently;
- Based on the business characteristics of the enterprise, it displays the classification characteristics of the current network traffic data at the key node locations, the real-time status of the whole network application traffic type distribution, and the visual display of the situation monitoring of the network status from the macro level.
Traffic data visualization value presentation
The MATRIX-SDN traffic data centralized control platform can query the current/historical traffic trend of capturing nodes, output nodes, policies and business objects, and clearly show the traffic change trend of any position in the network at any time from the macro and micro perspectives, so as to achieve the purpose of visualizing the global traffic of the whole network. Unified presentation through visualization. Based on user demand collection point, output point, business traffic trend, link traffic trend and other data sources, it shows a unified monitoring view based on HD screen, so that you can see the status of network traffic data at a glance.
The MATRIX-SDN traffic data centralized control platform can query the current/historical traffic trend of capturing nodes, output nodes, policies and business objects, and clearly show the traffic change trend of any position in the network at any time from the macro and micro perspectives, so as to achieve the purpose of visualizing the global traffic of the whole network. Unified presentation through visualization. Based on user demand collection point, output point, business traffic trend, link traffic trend and other data sources, it shows a unified monitoring view based on HD screen, so that you can see the status of network traffic data at a glance.
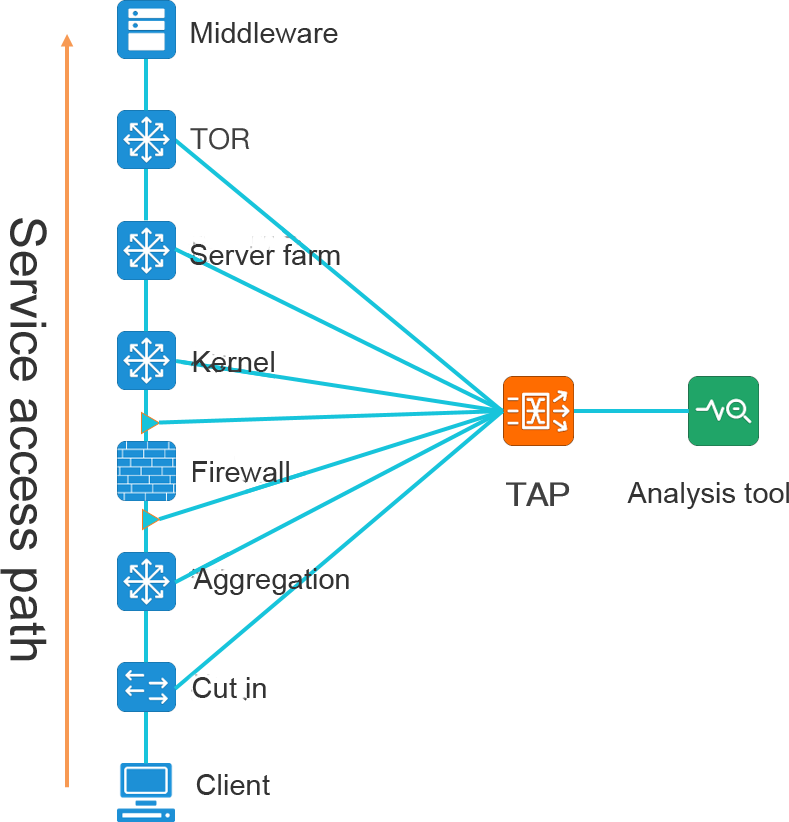
Traffic data collection in service network environment
Duplicate packets, confusion for analysis tools
The collection and summary of multi-point traffic data will produce duplicate traffic data, and there is also the possibility of data out of order.
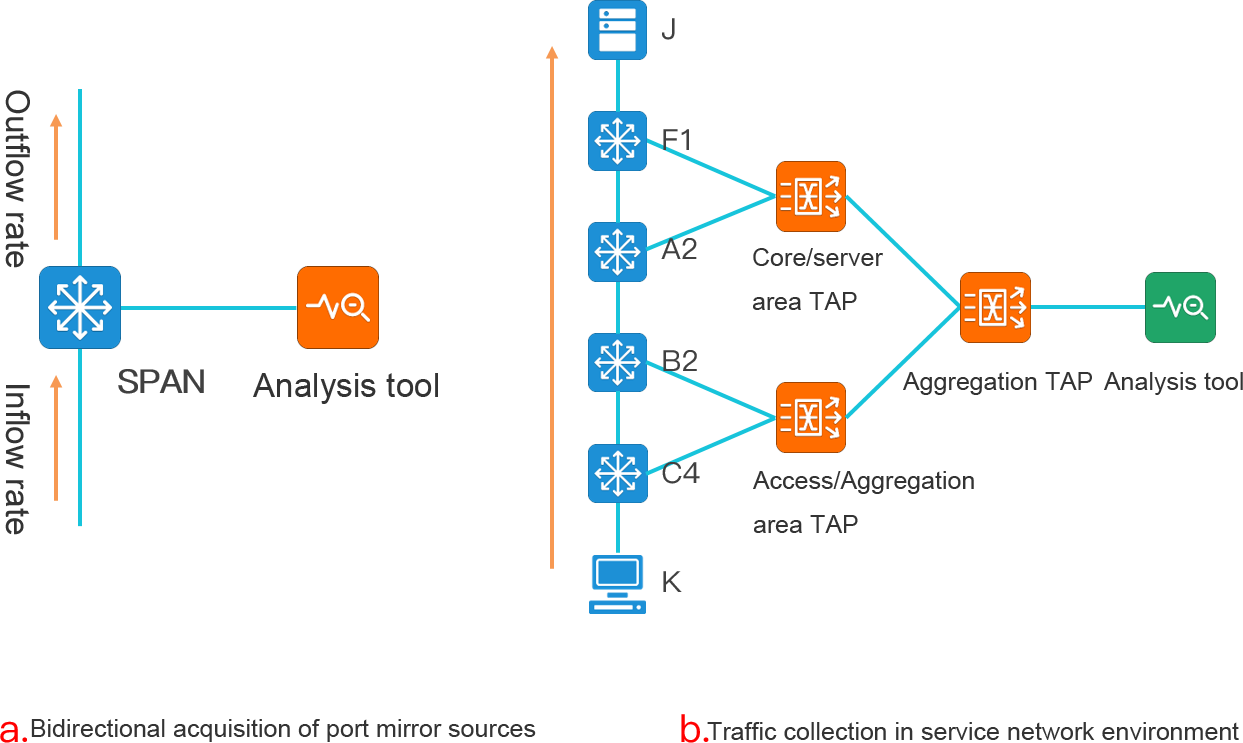
Figure a. Port image of the environment Because of the bidirectional traffic collection, the analysis system will receive two duplicate data sets of traffic in and out of the switch port.
Figure b. Traffic collection and aggregation of the environment, data sent to the analytics tool, will make the analytics system receive 7 duplicate data.
It is difficult for conventional analysis tools to distinguish duplicate traffic data, and multiple capture of the same packet will make analysis tools understand the behavior of network retransmission or multiple business transactions.
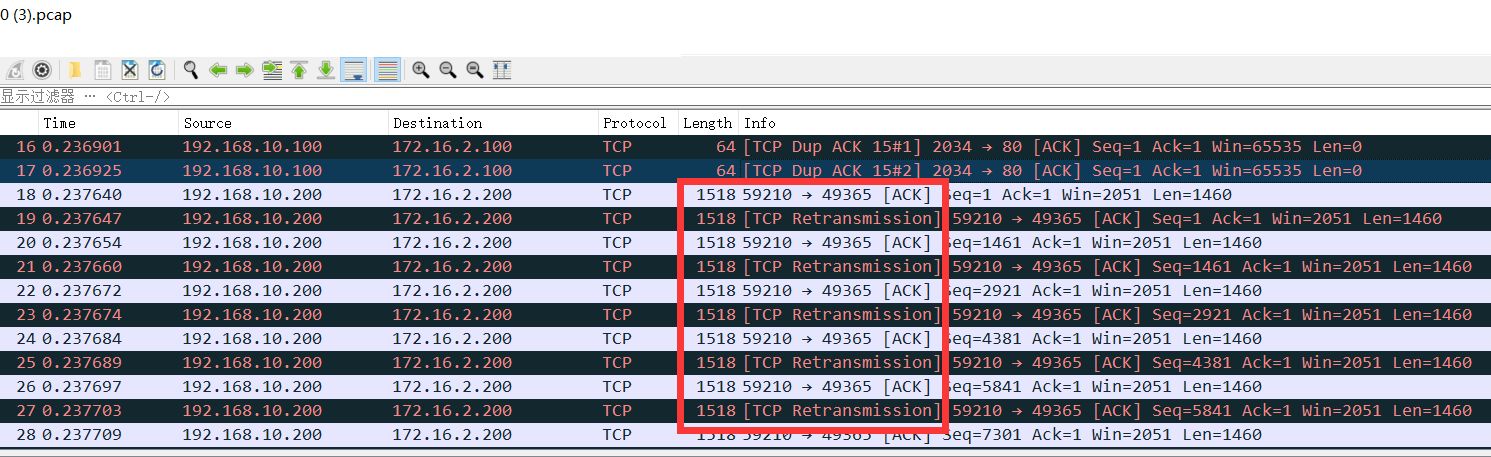
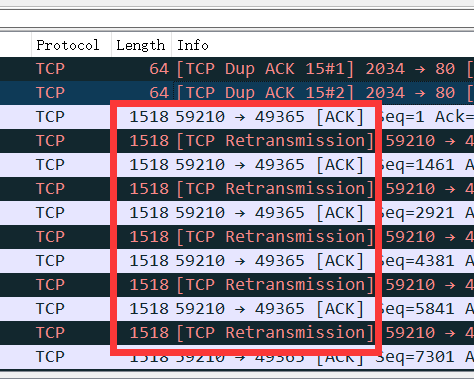
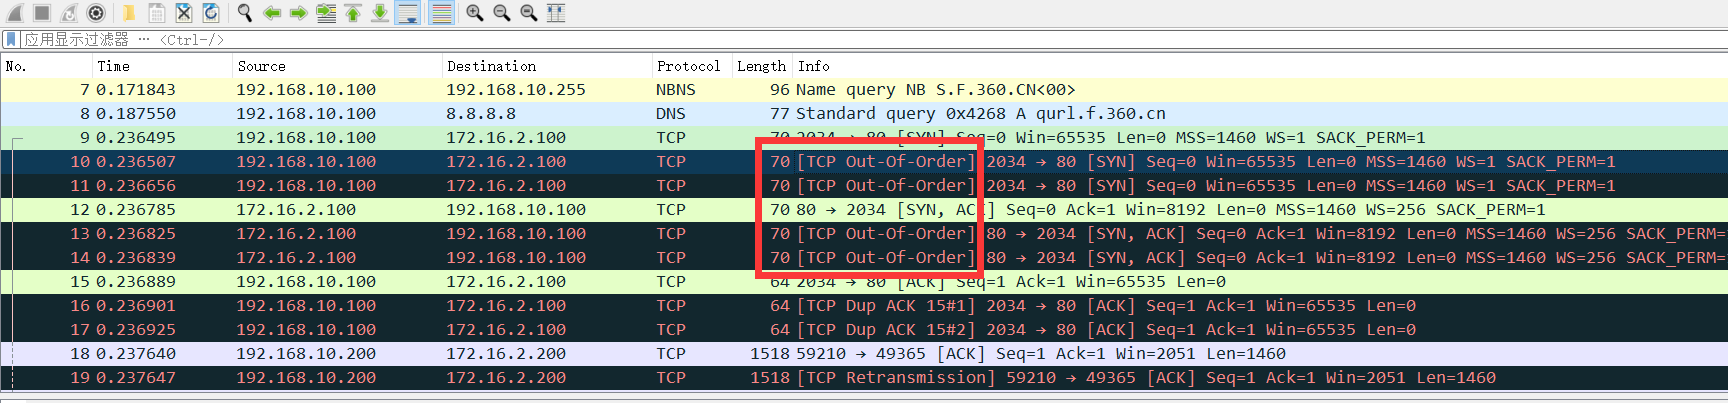
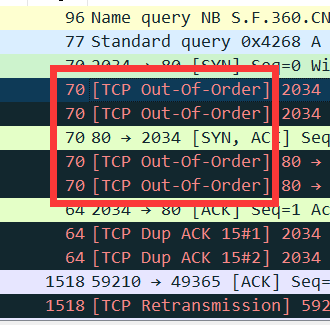
Taking the analysis of the data received by Wireshark as an example, the analysis of the packet with duplicate data shows that there are a lot of TCP retransmission and ACK repeat acknowledgment information inside.
In the multi-point traffic data collection and traffic aggregation scenario, the same traffic data is aggregated through TAP according to the established queue.
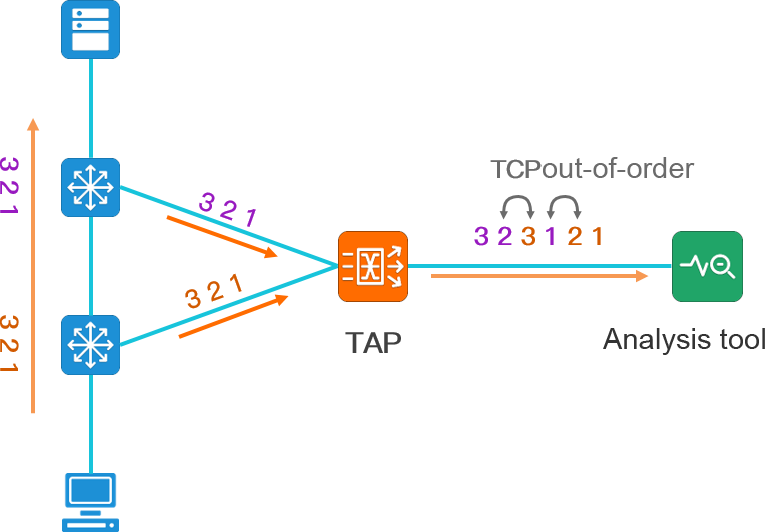
When the traffic data is aggregated, if the session queue information passing through the first device is not finished, and the second device starts to send the same session queue information, the traffic data of the two queues may be intertwined, and the message information of each queue is complete and correct. However, the analysis tools cannot distinguish the difference between the packets of the two queues, so the analysis tools will think that there is TCP out-of-order problem in the network communication.
The TAP device deduplication function ensures that the analysis system can correctly process the traffic data.
Taking the analysis of the data received by Wireshark as an example, the analysis of the packet with traffic aggregation shows that TCP out-of-order information appears inside.
Because the analysis system cannot effectively identify duplicate packets, giving such an analysis conclusion will interfere with the engineer's judgment of the problem.
Therefore, the TAP device will provide the deduplication function for packet deduplication processing.
Data duplication and deduplication in traffic data
The TAP device deduplication function ensures that the analysis system can correctly process the traffic data.
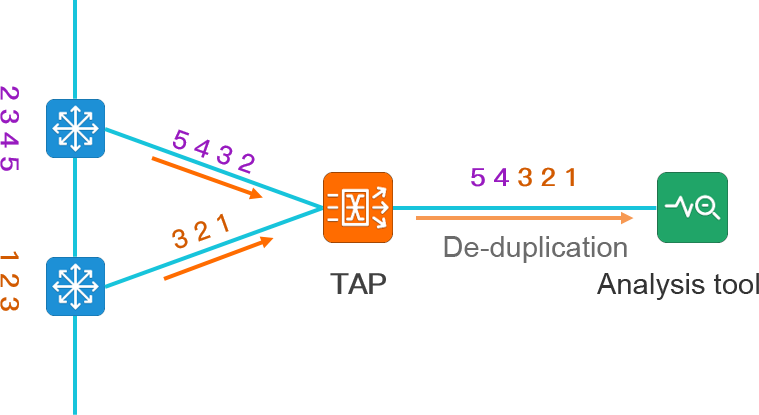
The TAP device compares the collected packets one by one, and if it finds duplication, the later incoming duplicate packets will be discarded. Removing duplicate data through TAP and exporting it can make the analysis tool parse traffic information normally, and also offload the analysis tool.
Depth analysis of duplicate data - mining the path of the message, accurate fault location
Complex business scenarios often involve multiple links such as routing, switching, NAT, firewall, load balancing, etc. The problems in each link of this application scenario may affect the entire business interaction. The analysis and management of transaction path is the focus and difficulty of user management, whether in the level of operation and maintenance, security access strategy, or network optimization.
Duplicate data is the data interaction proof of the key point of business transaction, and the effective use of duplicate data is the basis of path analysis.
To implement path analysis, TAP is implemented and the following information is covered in the packet:
-Provide location information
-Provide a timestamp
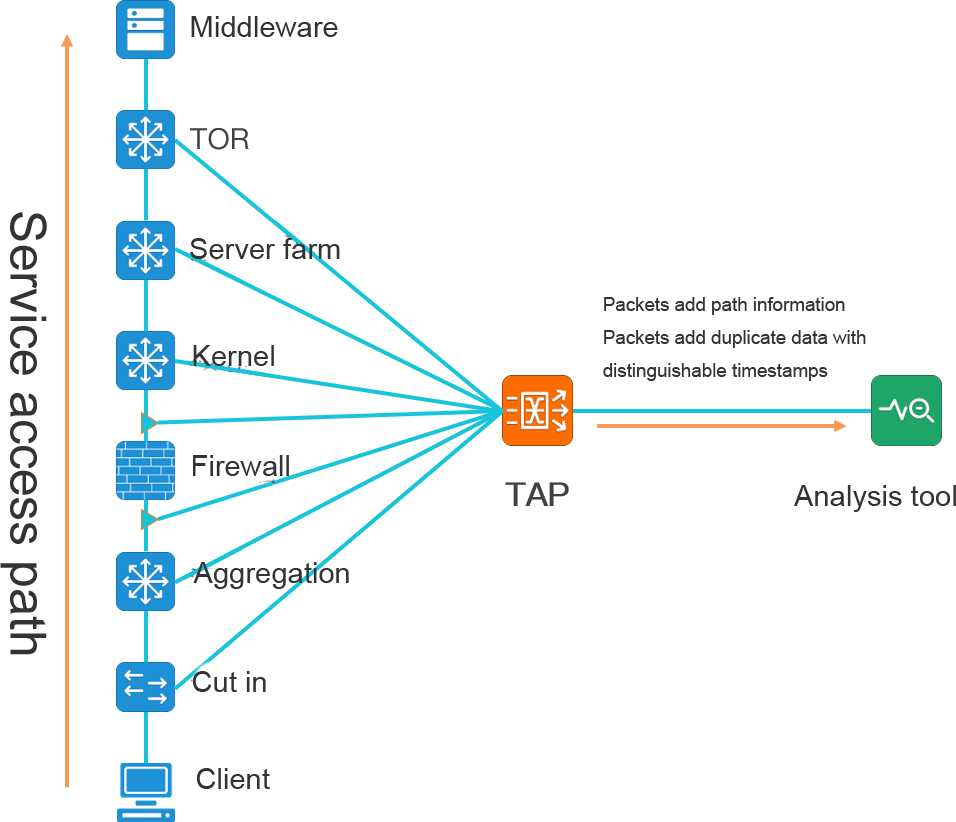
Through the whole network collection, location differentiation, time stamping and data association of TAP devices, the complete tracking and control of the transaction path can be realized.
In the business interaction environment, the path analysis function of the whole network can be used to realize: the path tracking of business transactions, the analysis and verification of firewall policy configuration, the analysis and verification of NAT address translation, the verification of routing and switching path, the load balance configuration, the analysis and monitoring of network element interaction time delay or jitter, and can clearly and completely show the data transmission process.
Comprehensive Application of Matrix-SDN Traffic data deduplication and Path Analysis - the perfect solution
Chengdu Multidimensional Matrix-SDN traffic data security solution covers both deduplication and path analysis considerations of traffic data.
Based on the visual perception of the macroscopic situation of the network, through the collaborative work of the visual analysis system and the traffic collection network, once the network is abnormal, any type of traffic at any collection point will be "photographed/recorded" through path analysis, so as to accurately save the abnormal field data at multiple locations in the network.
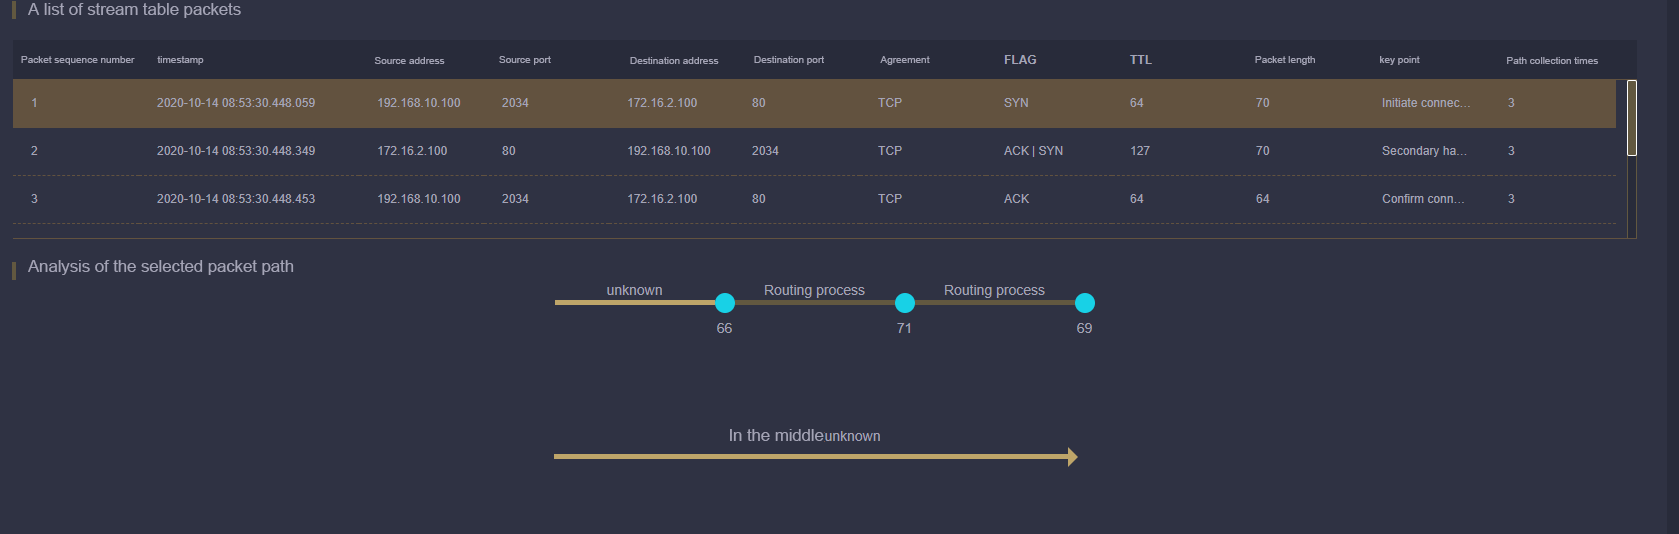
Based on the path analysis and its derivative "traffic data snapshot technology", the data scale of the abnormal state field is reduced to several gigabytes. Based on the network intelligence expert analysis technology, the analysis system compares the behavior of data packets at different network locations to help users accurately locate the abnormal fault point. Through the comprehensive and fine correlation analysis of multi-point data, the difficult problems such as how each data packet crosses the path of the network, where the abnormal data packet is initiated, and where it is lost are completely shown.
According to the path analysis requirements of different dimensions, it can also achieve:
Effectively identify and track the standard layer-3 routing and switching process of packets in the network.
It can effectively identify and track the source/destination NAT process of packets in the network without obtaining the real-time NAT session table on the existing network equipment.
Effective association between load balancers, firewalls and other processing equipment, including TCPSEQ modification and recombination association;
The forwarding delay of the same packet in two different acquisition node locations was analyzed accurately.
Correspondence analysis of upstream and downstream device manufacturer identifiers helps users identify and sort out the association between topology and data packets.
NSLP 2.0 standard understanding
The full name of “Network Security Level Protection 2.0” (Short as “NSLP 2.0”in this article) system is the basic national policy and basic system in the field of network security in China. Based on the standard of the 1.0 era, the classified protection standard pays attention to active defense, from passive defense to security and trust, dynamic perception and comprehensive audit of the whole process before, during and after the event, and realizes full coverage of the classified protection objects of traditional information systems, basic information networks, cloud computing, big data, Internet of things, mobile Internet and industrial control information systems.
In recent years, with the development of information technology and the change of network security situation, the requirements of NSLP 1.0 have been unable to effectively deal with new security risks and new threats brought by new technology applications. The defense based on passive defense of NSLP 1.0 cannot meet the current development requirements, so it is urgent to establish an active defense system. With the timely release of NSLP 2.0, there have been changes in laws and regulations, standards and requirements, and safety systems.
1. Changes in standard basis
From the regulations to the legal level. The highest national policy of NSLP 1.0 is Decree 147 of The State Council, and the highest national policy of NSLP 2.0 standard is the Network Security Law.
2. Changes in standard requirements
New security requirements are put forward for new technologies such as cloud computing, Internet of things, mobile Internet, industrial control and big data. The standard coverage is more comprehensive, and the security protection ability has been greatly improved.
3. Changes in security system
The related standards of NSLP 2.0 still adopt the concept of "one center and three kinds of protection", from the previous passive defense security system to the dynamic security system of defense in advance, corresponding in the event and audit afterwards. Establish a security technology system and a security management system, build a comprehensive network security defense system with corresponding levels of security protection capabilities, and carry out work such as organization and management, mechanism construction, security planning, security detection, notification and early warning, emergency response, situation awareness, capacity building, technical testing, security control, team building, education and training, and funding guarantee.
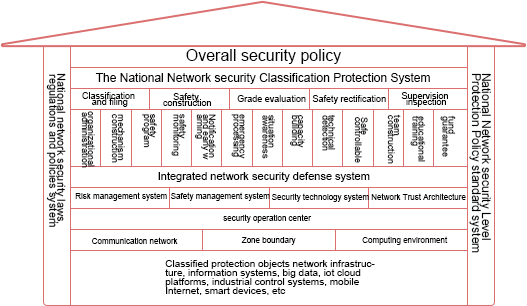
NSLP 2.0 "Traffic data" analysis requirements and management challenges
With the continuous implementation of NSLP 2.0, new challenges are constantly faced around the needs of network operation and maintenance, security analysis, and business operation and maintenance. "Traffic data" detection has been recommended as a means of NSLP 2.0 security to monitor and analyze network traffic in real time. The technical means of breadth analysis and depth analysis based on traffic data have played an increasingly important role in the fields of network monitoring and analysis, security threat detection and analysis, and business monitoring and analysis, which has brought significant demand growth for the side-channel traffic data management itself. At the same time, many dimensional analysis tools also bring great challenges to security and operation and maintenance personnel management.
Security detection: System, equipment, traffic, link, threat, attack, audit and other aspects are related to traffic data analysis, corresponding to the network security products are APT, IDS, database audit, network detection and so on demand traffic data support, and the deployed security equipment detection is a single node traffic data. And multi-dimensional security detection tools also make the switch equipment cannot meet. There is no real sense to do a comprehensive detection of traffic data, just to achieve a form of security detection purposes. At the same time, in terms of security, the full traffic data on a device is mirrored to these forms of security devices, which on the one hand causes pressure on the performance of security analysis equipment, and on the other hand, the security of traffic data cannot be guaranteed.
In terms of situation awareness, mass data collection, accurate detection ability, global visualization ability, and collaborative response ability all involve traffic data, which need the whole network traffic data as the analysis basis. The single deployment of the corresponding situation awareness equipment and a communication node will cause that the traffic data cannot be collected from the whole network and the whole network, and the traffic data in the virtualization environment cannot be obtained. In this way, the collaborative response capability of effective closed-loop cannot be formed, and the corresponding requirements in NSLP 2.0 cannot be fundamentally satisfied.
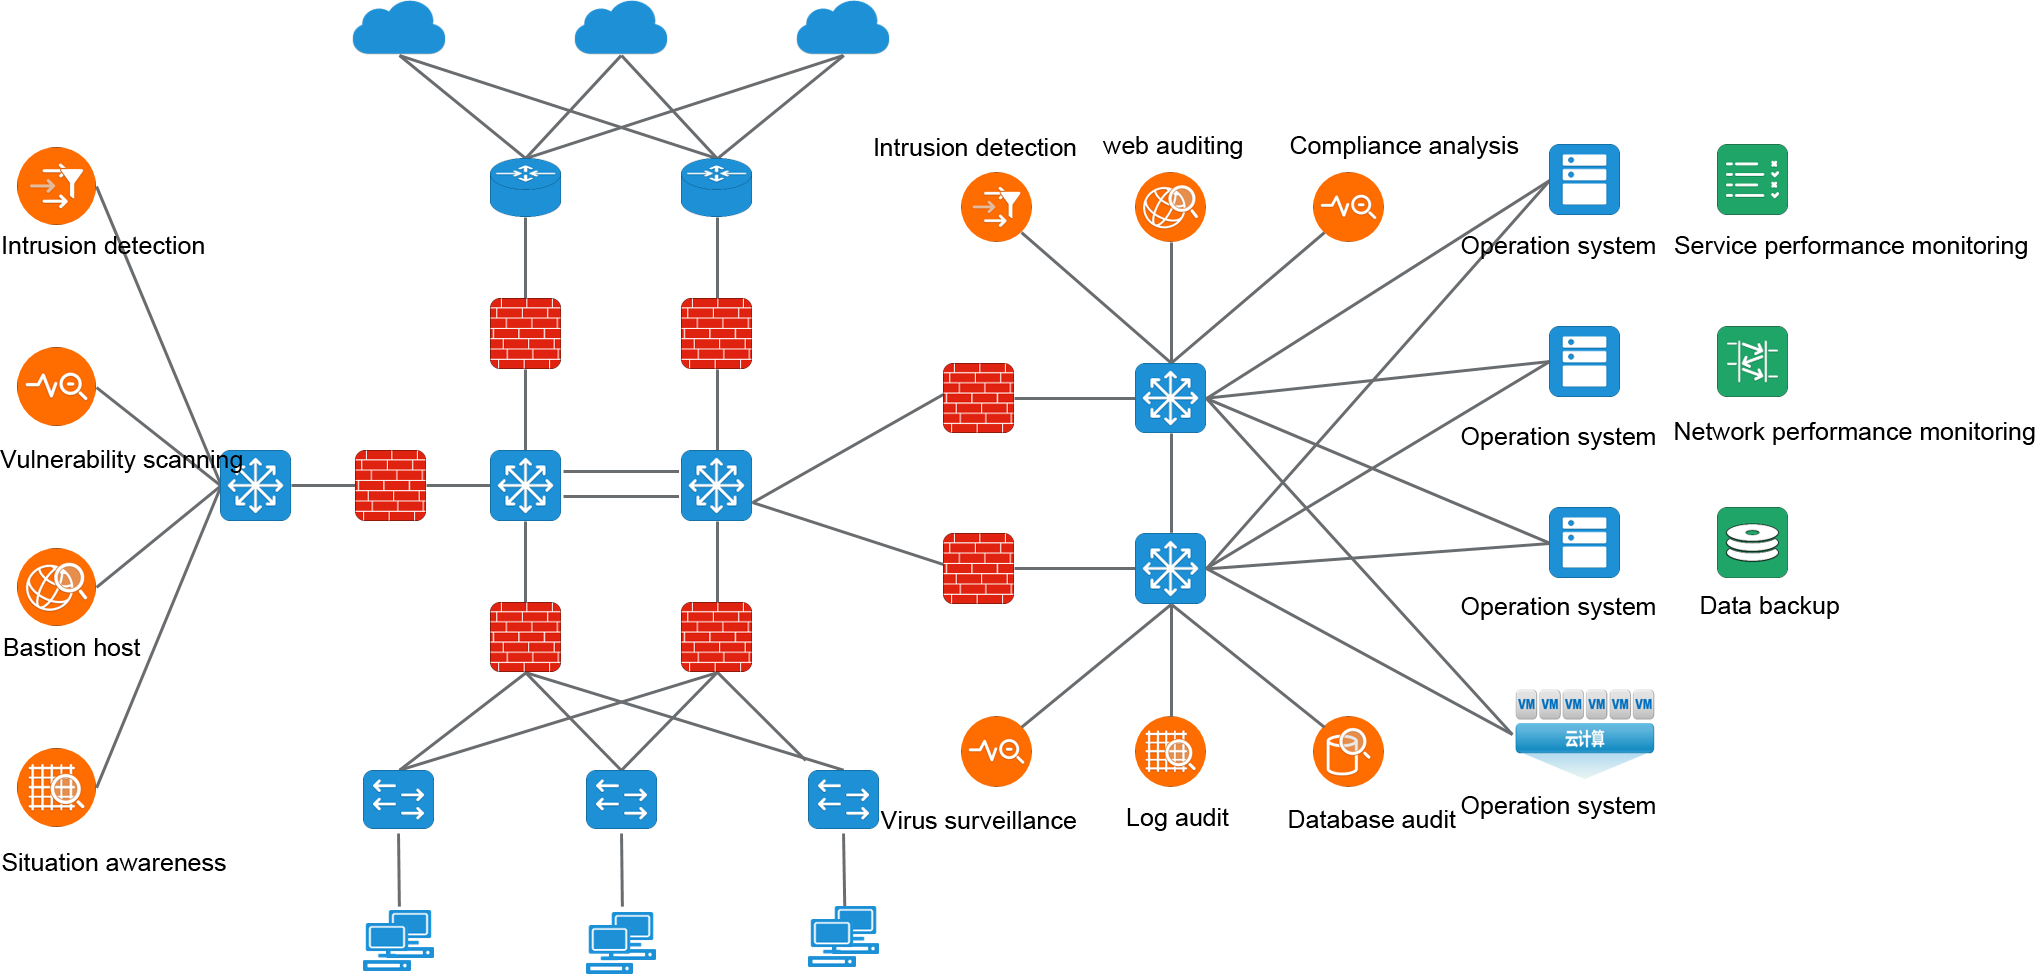
As shown in the above figure, security analysis tools (intrusion detection, WEB audit, database audit, virus detection, log audit, situation awareness) based on traffic data support under the construction of NSLP 2.0 need to be deployed in the network, which brings the following problems in traffic data management:
Multi-dimensional security analysis tools cause insufficient port image delivery difficulties;
-The analysis tool of "data center plus probe" makes it difficult to collect traffic data in the whole network.
-The source/destination management of traffic data is confusing.
-Virtualization/cloud network traffic data acquisition difficulties;
-Unrestricted distribution of traffic data is at risk of leakage.
Matrix-SDN" traffic data "is an important support for the implementation of NSLP 2.0
In response to the requirements of NSLP 2.0 traffic data management and the increasingly complex management of traffic data location and content, MATRIX-SDN adopts the design method of "traffic data oriented". Starting from the "traffic data" itself, Matrix-SDN does a full range of traffic data collection and traffic data management in the enterprise network, so as to cement the cornerstone of traffic data. Support the operation and maintenance/security business needs of IT systems, and truly meet the security management needs of traffic data in NSLP 2.0.
Network data collection, MATRIX-SDN traffic data collection network will be scattered optical and electrical links, as well as online optical splitting, bypass mirroring, virtual TAP in cloud computing/virtualization environment and other ways for centralized, network-wide traffic data collection, to achieve the full original traffic data capture of the user's current network. The real sense of meeting the mass data collection in NSLP 2.0.
Based on the sensitivity and importance of the traffic data, the content control of the traffic data, the source and destination of the traffic data are managed visually with a complete whole chain, the distribution requirements of the traffic data are controlled with minimal authority to meet the analysis requirements, and the content of the traffic data is classified, identified and desensitized with the necessary L2-L7 layers. The multi-directional and comprehensive control of traffic data management can effectively reduce the risk of traffic data leakage and improve the security of traffic data management. From the flow, link, attack, audit and other aspects to achieve the data security required in the NSLP 2.0.
Matrix-SDN management platform realizes an integrated topology view for user network plane topology, collecting plane topology and analyzing plane topology, and realizes an interconnected centralized and integrated display of the interconnection relationship between three plane topologies. In the face of complex traffic collection sources and traffic output logical relationships, managers can realize the perfect visual view display and management in the platform, which greatly reduces the workload of safety and operation and maintenance managers. It makes the management of security audit equipment necessary in NSLP 2.0 become more efficient and simple.
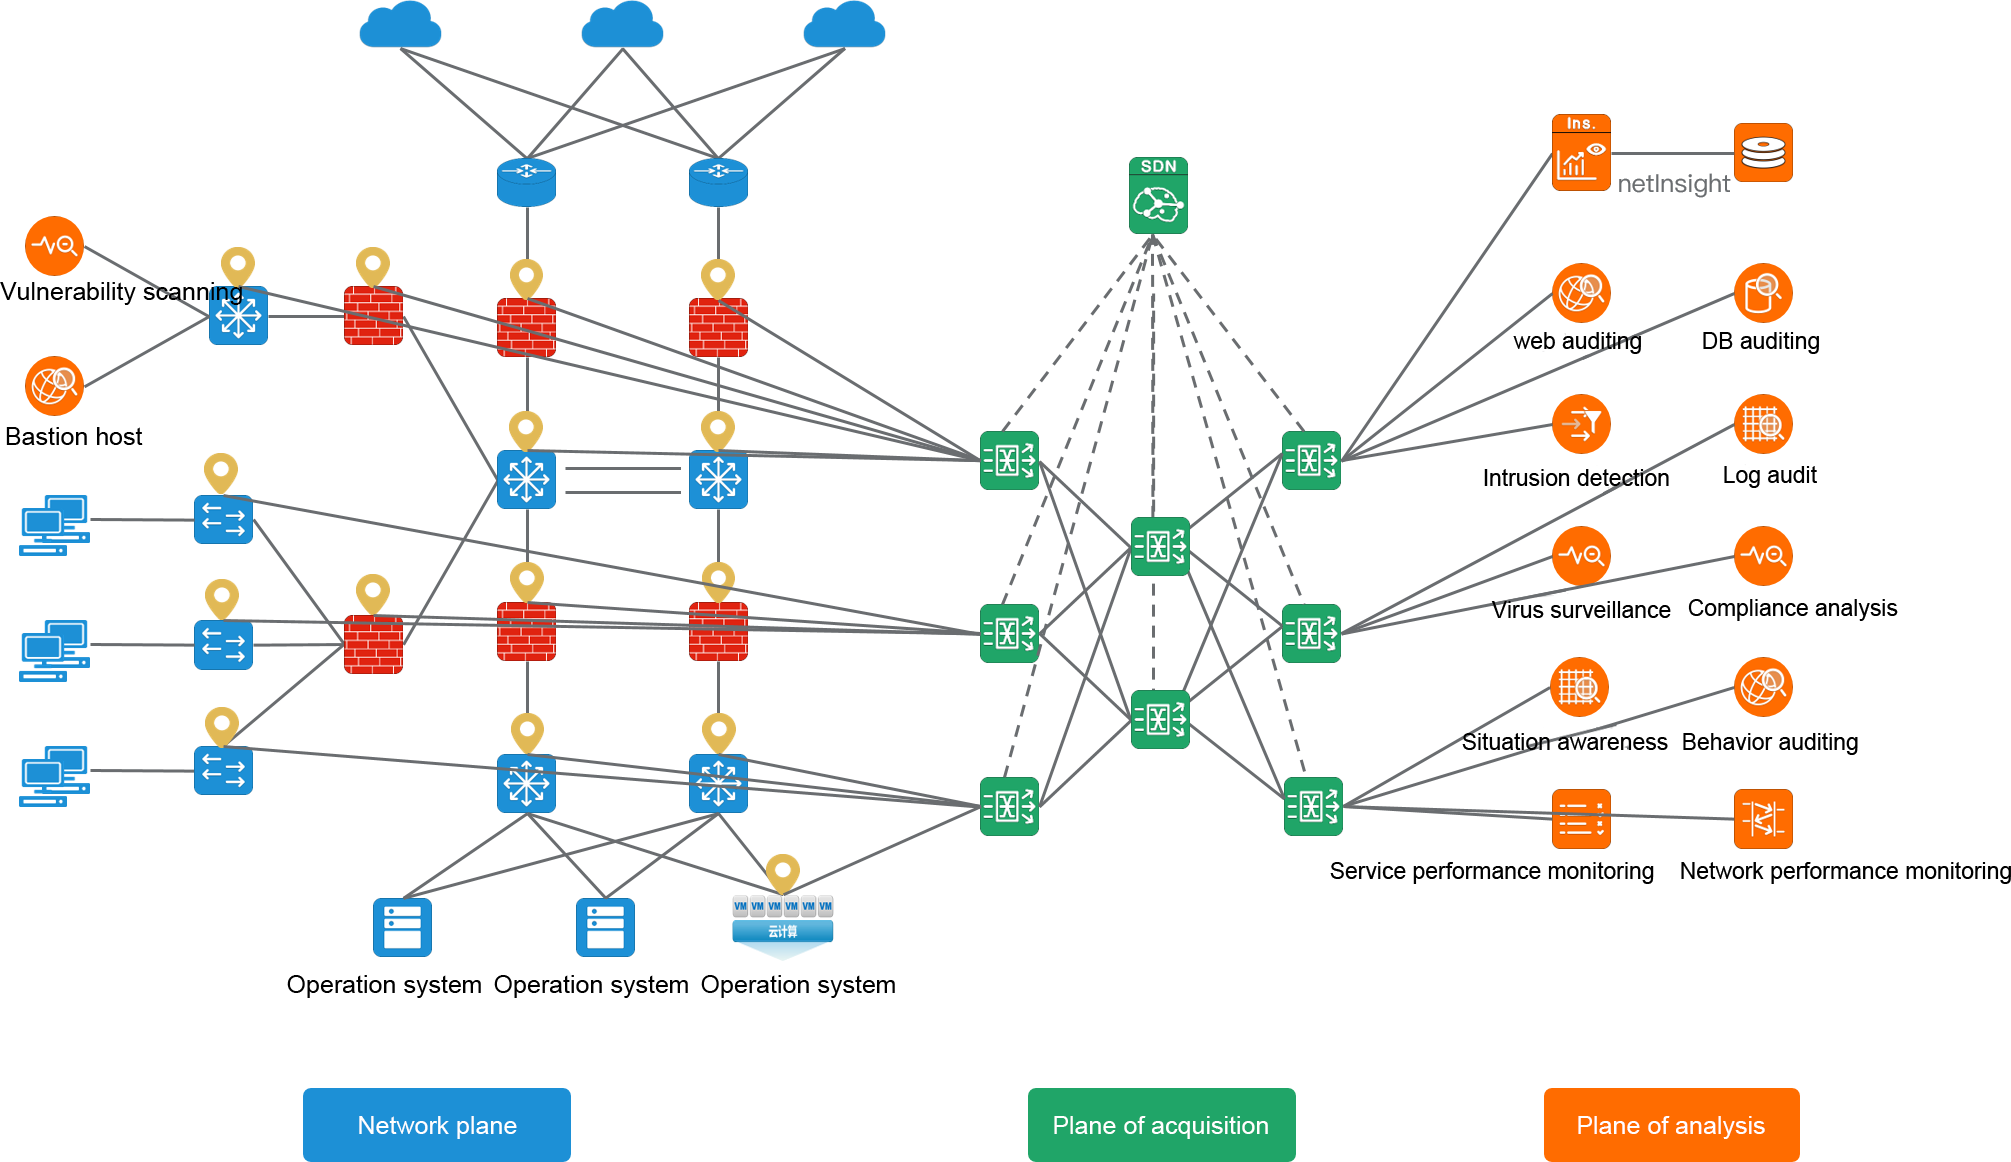
Traffic data management platform has been proven to play a key role in daily information security and network operation and maintenance as well as reassurance activities. Enterprises should pay attention to traffic data management, not only because the NSLP 2.0 evaluation requirements put forward a new standard, but also because the importance of traffic data management is becoming more and more clearly reflected in the global network environment, "know yourself and your opponent, win a hundred battles", the NSLP 2.0 evaluation requirements for traffic data management, Is reflecting the national attention to the construction of network security environment, such as traffic data management of new technology in the network security industry application and popularization has become necessary, the enterprise network security, social network security and national network security are of great significance.
Backtracking Analysis - an essential tool in the era of MSLP 2.0
The Network Security Level Protection System 2.0 standard (NSLP 2.0) was officially released, and vigorously began to implement. "Traffic data" detection has been recommended as a security measure. In terms of security detection: system, device, traffic, link, threat, attack, audit. Situation awareness: massive data collection, accurate detection capabilities, global visibility capabilities, collaborative response capabilities. In "Information security technology network security level protection test and evaluation requirements", the requirements of "traffic traceback analysis system" and "traffic storage" are put forward for the first time. We will introduce the traffic traceback analysis system in the Classified Protection System 2.0 from the perspectives of product functions and technical requirements, respectively.
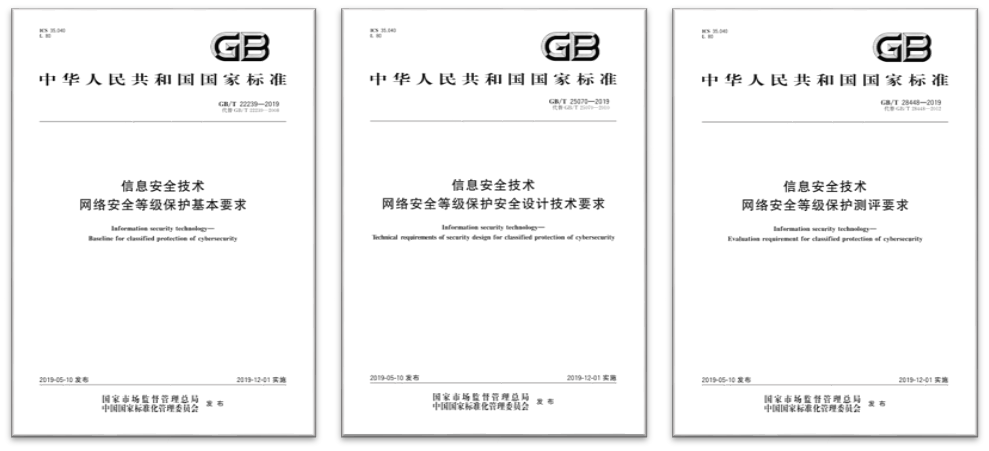
Traffic data traceback analysis system is a kind of network security infrastructure. A reasonable and complete traffic data traceback analysis should include three stages: data investigation, traceback and forensics. Real-time monitoring and analysis of network traffic, artificial intelligence learning, traffic data storage. Discover suspicious activities and security threats hidden in massive traffic to help enterprise security teams accurately detect compromised (controlled) hosts, locate attacks, trace attack chains, and prevent attackers from further damaging the system or stealing data.
From the system architecture, the traffic traceback analysis system needs to have at least the following modules:
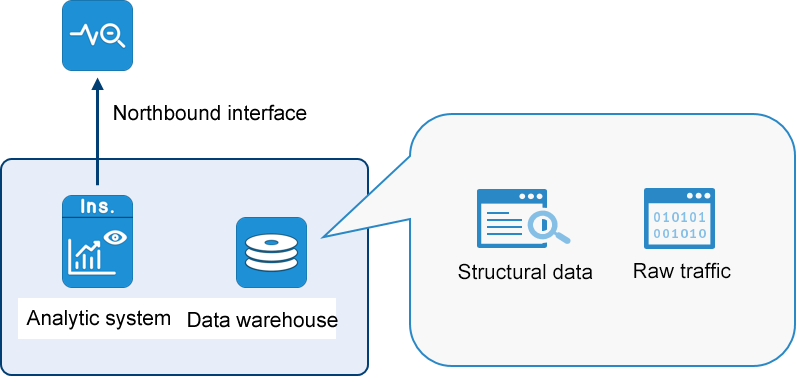
Full traffic file extraction and pcap storage: the protocol recovery of the full network traffic is carried out, the network traffic information is extracted, all alarms and suspicious network behaviors are saved in pcap for subsequent analysis, and the visualization ability is provided for in-depth analysis of network behaviors.
Traffic traceback analysis module: by detecting the summary information of the equipment, through real-time traffic data detection and offline traffic data detection, it can quickly analyze various dimensions of information on the basis of the original traffic data.
Artificial intelligence machine learning model detection module: it applies artificial intelligence machine learning algorithms to detect network threats that cannot be found by traditional statistical rules, such as data theft, tunnel communication behavior, etc.
Custom threshold alarm module: Support to provide custom threshold alarm function, and applied to real-time traffic detection;
Attack chain traceback analysis module: all discovered threat alerts can be related according to the attack chain, and the attack process can be traced completely.
Traffic data storage module: store massive traffic data, and deal with traffic data traceability and forensics.
From a functional point of view, a traffic traceback analysis system should have the following characteristics:
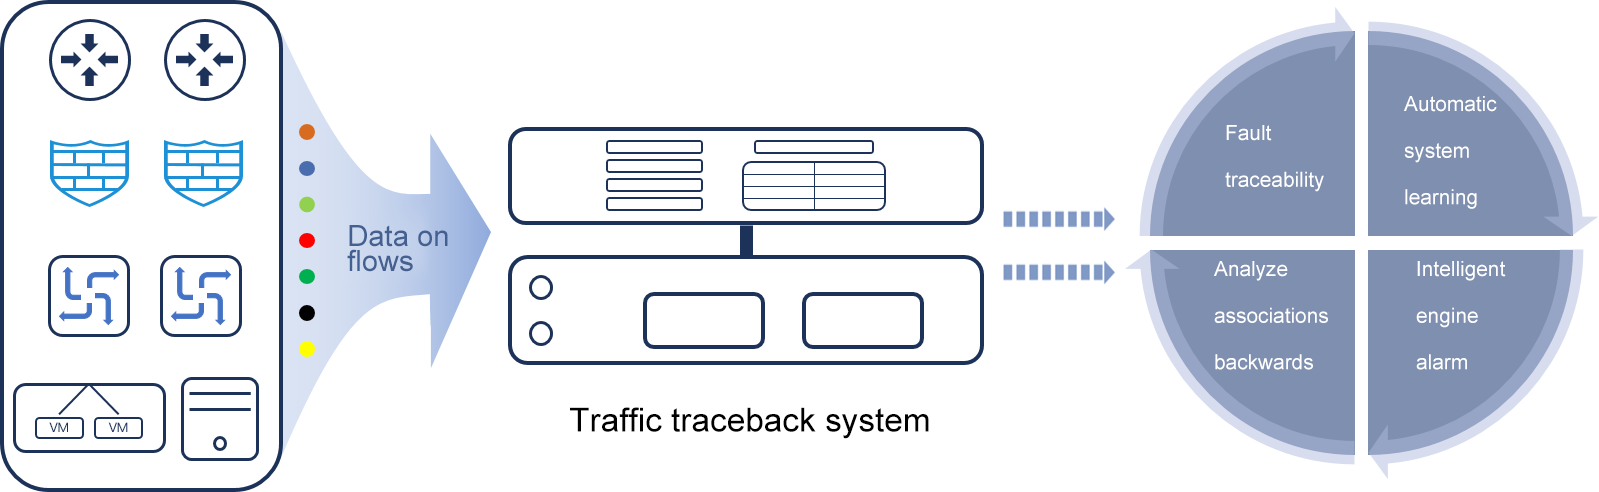
1-Quickly detect threats and accurately locate the controlled host
The primary role of traffic traceback analysis system is to complement the missing link of traditional border protection equipment in defense based on alarm, play a role in key links such as "command and control", "lateral movement" and "mobile data theft", quickly detect ongoing threats, and combine traffic analysis and network monitoring to quickly and accurately locate the controlled host.
2-Trace the whole process of the attack chain, and find the behavior of stealing data and damaging the system in time
The core capability of traffic traceback analysis system is to find abnormal traffic information in network traffic by using a variety of detection mechanisms. The detection mechanism includes application access relationship analysis, traceback traffic trend analysis, traceback traffic statistics analysis, traceback packet length distribution analysis, traceback geographical location distribution statistics analysis, traceback session analysis, traceback session statistics analysis, traceback packet analysis, traceback TCP session quality analysis, traceback TCP session anomaly distribution analysis and so on. Using the above analysis method, not only the internal machine is located, but also the whole stage of tracking network threats can be correlated up and down. Malicious behaviors inside the network can be found in time, and malicious behaviors such as data theft, system damage and business continuity can be detected.
3-Provide rich alert context, clearly show network related information, and guide the security analysis team to analyze and respond quickly
Traffic traceback analysis system can clearly classify threat events, and provide rich context information of threat events according to threat intelligence, so as to map the behavior of hosts from the perspective of attack chain, and visualize all the compromised alerts, associated hosts, threat types, etc. to show all the compromised situations and associated threats in the current organization.
Solution for backtracking analysis -MATRIX-NetInsight
Traffic data is the direct embodiment of user's IT business behavior. Traffic data traceback analysis can provide user's IT behavior, conclusion, basis and certificate based on traffic data. The traffic generated by abnormal network access behavior or attack events may be fleeting. By crawling the network traffic, the parts that need to be concerned are extracted and post-hoc multi-dimensional analysis is carried out. It is of practical significance to realize real-time discovery, analysis and traceback for user critical business systems, applications and network behavior anomalies.
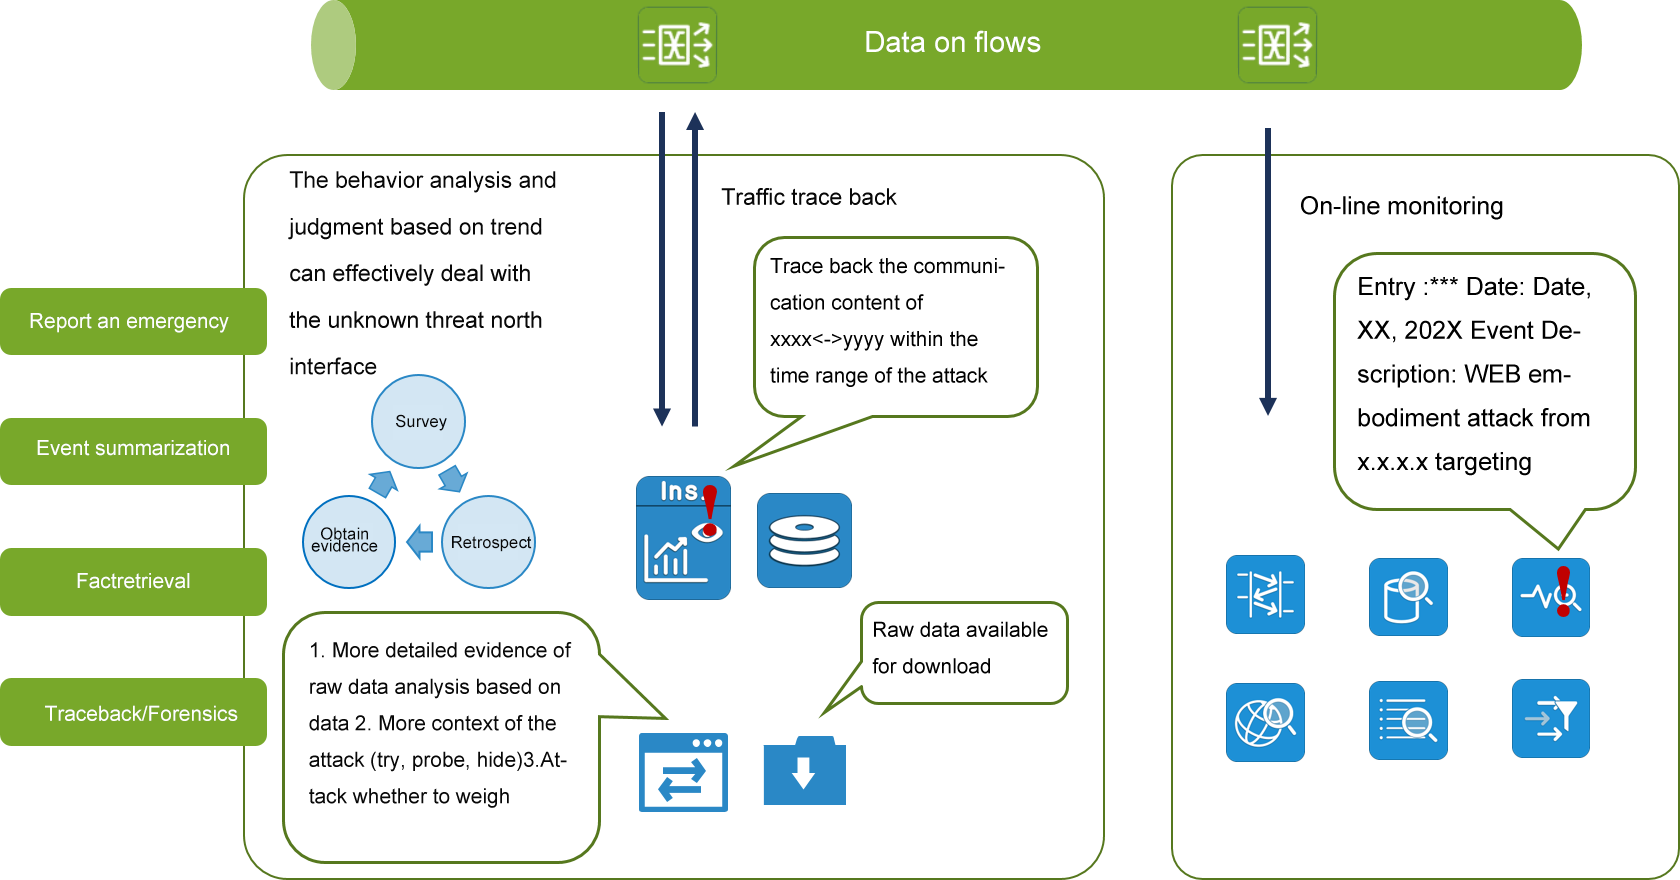
MATRIX-NetInsight Network traceback analysis system components, including:
-Data storage has long-term, horizontally scalable data storage capabilities; Provides quintuple analysis and data summary information.
-Behavior forensics, the ability to backtrack the stored data, can backtrack and analyze the network behavior that has occurred, and provide users with network problems tracking and forensics;
-Download traffic data and push traffic data to other security/behavior analysis systems;
-Visualization of data traffic and data content;
-Failure behavior Analysis based on big data.
MATRIX-NetInsight supports the full collection, storage and traceback analysis of network traffic, which is widely used in audit forensics, responding to unknown threats and other fields.
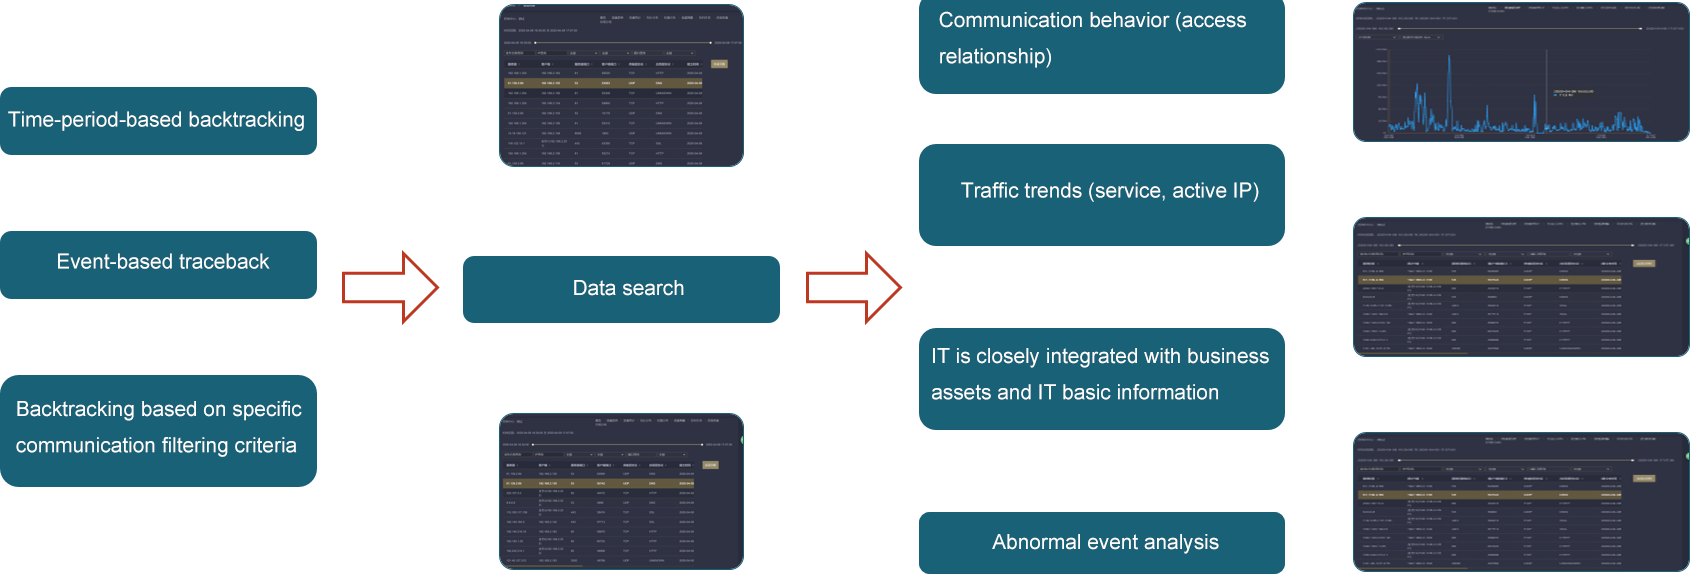
Backtracking traffic trend analysis, total traffic, specified service, specified IP address, specified network protocol, specified application protocol traffic trend show; Presentation of data delivery ratio/packet delivery ratio/number of concurrent connections/connection frequency Line chart/stacked area chart, etc.
Retrospective traffic statistical analysis, business, IP address, network protocol, application protocol traffic Top10 display; Statistical display of the total number of bytes, the number of bytes sent, the number of bytes received, the total number of packets sent, the number of packets received, the total number of connections, the highest number of concurrent connections, and the highest connection frequency; Bar chart/circle chart, etc.
Backtracking packet size distribution analysis, analysis and display of packet size distribution of specified network protocol and application protocol; Bar chart/circle chart plus list presentation.
Backtracking geographical location distribution statistics, the statistical object is the number of bytes/packets/connections/connection frequency of geographical location Top10 statistical display; Bar chart/circle chart plus list presentation.
Traceback session analysis, TCP and UDP network session analysis presentation Display setup time, end time, duration, server IP, client IP, server port, client port, transport protocol, application protocol, total bytes, server bytes, client bytes, server packets, client packets, average packet length, and session status. Fuzzy query function of the above data.
Traceback session statistical analysis, the session statistical function for a specified service or IP, the statistical object is the number of client traffic or connections accessing the service or IP; Bar chart/circle chart plus list presentation.
Backtracking packet analysis, the presentation of the original content of the packet; Hierarchical analysis and presentation of data packets, including Ethernet frames, IP packets, TCP/UDP packet structure and offset analysis.
The access relationship between service and IP was analyzed, and the access relationship of specific service or IP was graphically displayed. Key service name, IP address, transport layer protocol, application layer protocol, port fuzzy query.
Backtracking TCP session quality analysis, TCP session quality analysis functions, including attempted link establishment, successful link establishment, successful link establishment, unresponsive link establishment, connection reset, connection reset rate, retransmission number, retransmission rate, zero window, average link establishment duration, minimum link establishment duration, maximum link establishment duration, RTT, etc.
Distribution analysis of backtracking TCP session anomalies, including graphical presentation of the time distribution of reset, retransmission, and zero-window metrics.
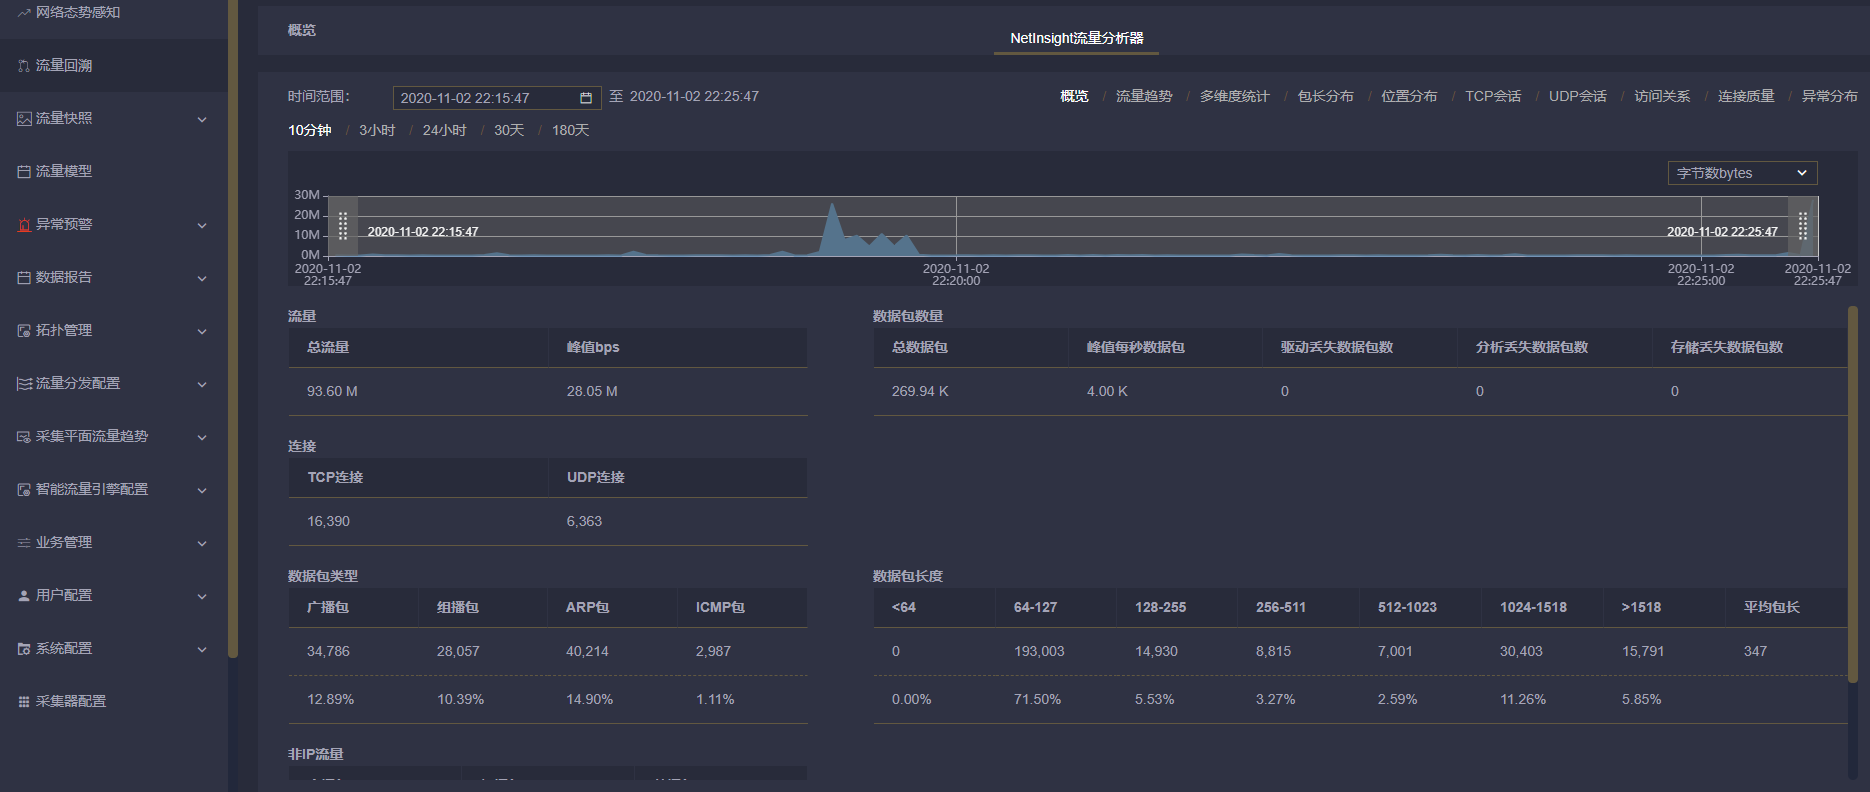
According to the requirements of NSLP 2.0, post-audit, backtracking and evidence collection are important contents of network security analysis. The network and communication security part of the system involved in such NSLP 2.0 can realize the detection and analysis ability of network attacks, especially unknown new network attacks, by deploying a traffic traceback analysis system. Due to the consideration of function design and data versatility, the existing security analysis tools usually do not have the function of original traffic data storage. Users will encounter great obstacles when tracing the source of attacks and requiring discovery, tracing and forensics. Based on the above reasons, users urgently need traffic traceback analysis capabilities to solve the needs of network event traceback and forensics, and to deal with new network attacks. The application and popularization of traffic traceback analysis system in network security has become necessary, which is of great significance to enterprise network security, social network security and national network security.
Development Background of traffic data management
With the development of China's society and economy, the level of enterprise information technology continues to improve, the network architecture has undergone earth-shaking changes. Based on the improvement of information technology, the architecture of information systems and applications is constantly evolving, which puts forward higher requirements for enterprise network architecture, enterprise IT assets operation and maintenance, and enterprise information security management means. Based on the rich data connotation of "traffic data" itself, the analysis value of "traffic data" is determined. In the process of continuous development of information/network, "information security analysis", "business health analysis", "IT operation and maintenance big data analysis" and other countless multi-dimensional analysis around traffic data have been widely used in IT informatization of all walks of life, which strongly guarantees enterprise information security and the normal operation of IT systems.
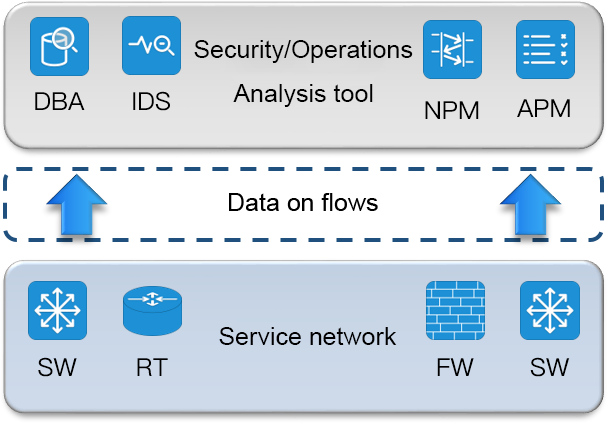
This article begins with a brief review of the three phases of traffic data management to date. Then, the third phase of traffic data management architecture innovation, namely Traffic Data Visual Management (Matrix-SDN), will be presented along with the technical power and operational challenges driving its adoption by large enterprises.
Development history of traffic data management
Traffic data management is a purpose-built infrastructure that outputs traffic data from the business network to security/Operations analytics tools. It serves as a bridge between business networks and security/Operations tools. Traffic data management technology has a development history of more than ten years, and has probably experienced several development stages. The first phase is traffic data acquisition phase, in order to solve the shortage of network device port mirror. The second stage is the traffic data preprocessing stage, which preprocesses the traffic data to improve the security of traffic data and optimize the efficiency of security \ operation and maintenance analysis tools. The third stage is traffic data control stage due to the needs of business scenarios under modern IT architecture. The overall sorting of traffic data, data as the core management. Over the past two decades, a wave of technological innovations has dramatically improved the state of the art in traffic data management.

Phase I - Traffic Data Acquisition (2008-2012)
Requirements: Unavailability of traffic data, insufficient port mirroring, growth of security monitoring tools, development of operational tools.
Features: Traffic replication, traffic aggregation, traffic diversion, traffic filtering.
TAP switch by Inline or SPAN connection in the network, the collection of network mirror or split traffic data, can be copied to multiple ports, or the multiple data to a single port, and then to the back-end needs to analyze the traffic, monitoring system applications, but also according to certain rules to filter out the analysis platform wants to mirror traffic data.
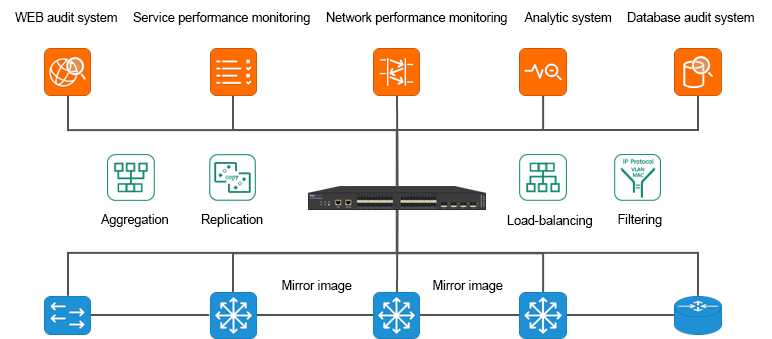
Phase 2- Traffic Data Preprocessing (2012-2016)
Requirements: special requirements of traffic data, dynamic traffic data capture, support operation and maintenance troubleshooting.
Features: deduplication, desensitization, slicing, timestamp, encapsulation/de-encapsulation, tunnel inner layer identification and matching, DPI data classification identification.
Description: TAP switch not only performs "aggregation, distribution and filtering" on image data, but also can process higher functions such as "deduplication, desensitization, truncation, timestamp, encapsulation/unencapsulation, tunnel inner layer identification and matching, DPI data classification and identification", and then send the processed image data to the back-end analysis tool. Meet the special requirements of traffic data and support operation and maintenance.
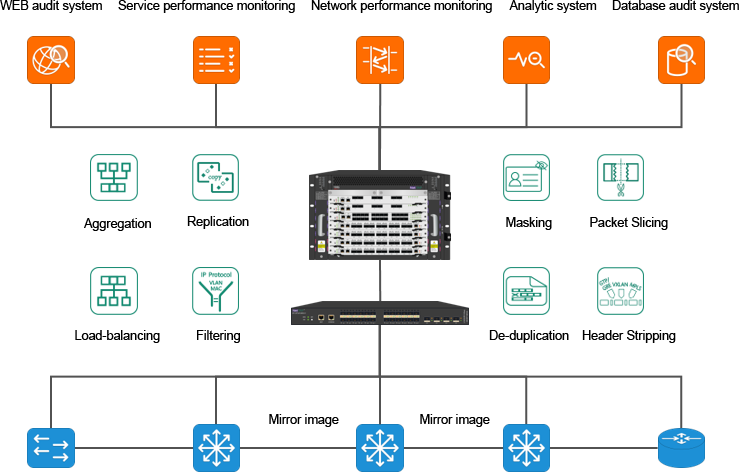
Phase 3 - Traffic Data Management (2016-present)
Requirements: Around the management of traffic data, meet the traffic demand based control, the proposal and implementation of national security strategy.
Features: data-centric management (data distribution, data processing, data monitoring), intelligent, flexible traffic data management, big data display, multi-dimensional AI analysis of node traffic, anomaly monitoring, analysis integration.
Description: As the traffic data demand increases. The centralized collection, free networking, and unified distribution of traffic data realize the identification of traffic data content, classification control and distribution based on content, and finally form a set of "traffic data-oriented" traffic data control to realize big data display of traffic data, multi-dimensional AI analysis of node traffic, anomaly monitoring, and analysis integration platform.
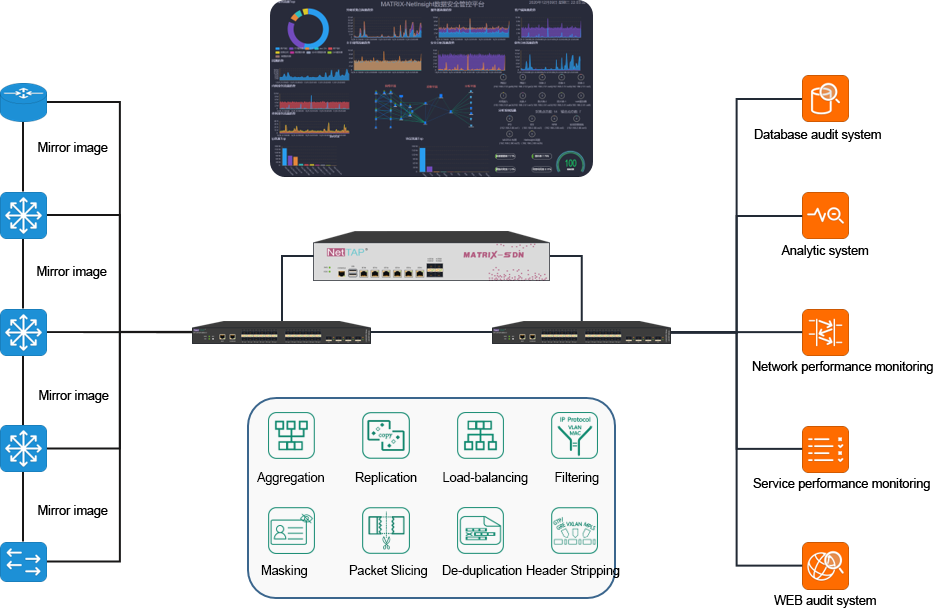
The third phase of the Matrix-SDN architecture
Benefiting from the advanced SDN technology concept, the SDN technology was innovatively applied to the centralized collection, free networking and unified distribution of traffic data, and the advanced NP+ASIC chip solution was combined to realize the identification, classification control and distribution of traffic data content based on content. Implement the three-plane architecture of "capturing plane", "network plane" and "analysis plane". Finally, a set of Matrix-SDN traffic data control platform "oriented to traffic data" is formed, which provides a perfect solution for the traffic data management of enterprises and paves the way for the future traffic data demand management, such as "traffic data middle platform", "traffic data security control" and "fast traffic delivery".
Traffic data networking
Taking SDN technology as the core and the advanced architecture of separating the "control plane" and "data plane" as the guiding ideology, the traditional traffic collection hardware is SDNized, which provides flexible networking capabilities for the unified collection and distribution of traffic data.
Source/target visualization
The MATRIX-SDN management platform realizes an integrated topology view for user network plane topology, collecting plane topology and analyzing plane topology, and realizes an interconnected centralized and integrated display of the interconnection relationship between three plane topologies. Managers facing the complex traffic collection sources and traffic output logical relationship can realize the perfect visual view display and management in the platform, which greatly reduces the workload of managers.
Data-oriented control
The MATRIX-SDN platform leads the industry trend, abandoning the traditional idea of "device-oriented control" and realizing the centralized control of traffic data "data-oriented control". Users can realize more refined and flexible data delivery based on different content classification of network traffic data, which builds a solid foundation for network information security analysis /IT operation and maintenance analysis. It reduces the risk of traffic data leakage and improves data security.
Dynamic traffic data capture
MATRIX-SDN provides you with the data probe function at will. Through dynamic data probe on any covered collection point position on the MATRIX-SDN platform, it can directly detect whether there is a fault communication endpoint and whether there is a communication behavior, so as to eliminate the problem of incorrect client configuration. Multiple nodes simultaneously detect the bidirectional communication behavior of the specified communication endpoint to further locate the network/security device policy configuration problem. The data filtering function based on tuples is based on the flexible data probing hand provided by MATRIX-SDN, so that the operation and maintenance personnel can obtain the original data they want to analyze anytime and anywhere. Direct the most effective and efficient means of locating and resolving faults.
Virtual-real combination, integrated cloud capture
Combined with MATRIX-SDN traffic data collection network, vTAP traffic collection software is deployed to collect east-west packets between virtual machines in VMware, OpenStack and Hyper-V environment. Through vTAP software, it can realize the collection of packets between virtual machines that cannot be collected by traditional methods. It solves the difficulty of obtaining virtualization/cloud network traffic data, and realizes the centralized control of traffic data with "full coverage of east-west traffic". Build comprehensive coverage of east-west traffic data for service analysis/security detection analysis. So as to realize the comprehensive coverage and collection of traffic data in a complete sense, unified centralized control, and traffic data visualization.
AI Intelligence network/business anomalies
Through multi-node traffic data collection and real-time packet/service statistics of the whole network, periodic network/service characterization data based on different network location nodes, different service data flows, different packet characteristics (single/group/multicast, packet length, marking) and other dimensions are generated, and the characterization data is input into the AI model for training. After several training, the multi-layer neural network algorithm will automatically form the internal functional relationship model of each characterizing data under normal conditions, and make accurate judgment and early warning of data representation under abnormal network/business conditions based on this model. Ai-based early warning can effectively perceive the business or network anomaly representation in the enterprise network, make effective early warning at the first time, strive for advance reaction time for IT operation and maintenance support staff, and trigger the system traffic snapshot field data capture, effectively improve the efficiency of fault resolution.

The Matrix-SDN scheme drives innovation in the third phase
The integration of advanced SDN technology and advanced NP+ASIC chips to build a scientific traffic data acquisition network, in response to the growing demand for traffic data, increasingly complex traffic data location, content management needs, using the "traffic data oriented" design, everything from the "traffic data" itself, The traffic data of the physical network and the cloud network in the enterprise network are collected in all aspects to achieve comprehensive coverage of traffic data and eliminate monitoring blind spots. Moreover, the traffic data is sorted out based on the business data type, and the data sensitivity characteristics, business interaction characteristics and protocol characteristics of different business interaction data flows have good aggregation. In order to reduce the security risk of traffic data and improve the security of traffic data, it establishes different classification flow data for different business systems, manages and controls the distribution of traffic data with different classification, and provides traffic data to different traffic data analysis tools based on the principle of "minimizing data rights". It realizes a unified display of the logical topology architecture of the current network, clearly shows the logical location and collection method of the traffic data collection point, and shows the topology architecture of the traffic collection network itself, and monitors and manages the working status of the collection unit and the traffic distribution status in real time. So as to achieve the logical topology of the traffic source, processing process and destination visualization. Clearly show the traffic collection location, processing strategy, input and output information, so that the control strategy of traffic data is changed from complex to simple. It realizes dynamic acquisition of traffic data, provides flexible data detection hand and convenient data detection function, performs dynamic data detection on any covered collection point location, directly detects traffic data information of communication endpoints, and allows operation and maintenance personnel to obtain the original data they want to analyze at any time and anywhere. It is a powerful security operation and maintenance support tool. Direct the most effective and efficient means of locating and resolving faults. Consolidate the foundation of traffic data to truly support the operation and maintenance/security business needs of IT systems.
With the continuous development of cloud computing technology, the traditional network architecture has been unable to meet the existing business needs, more and more applications in the network data center have migrated from the original physical machine to the cloud platform, and the east-west traffic in the cloud environment of the data center has increased significantly. Network traffic collection and analysis has become an indispensable means of analysis for data center infrastructure. Through the depth analysis of network traffic, we can speed up the fault location more intuitively, analyze application data, help optimize the location, and speed up the fault location. Network traffic collection is also a knowledge, do well will play a role in the critical moment, traffic collection is not simply a few network equipment port traffic image sent to the analysis server is done, to establish a comprehensive coverage, reasonable and effective traffic collection network, such traffic collection can help optimize network and business performance indicators, reduce the probability of failure.
Network traffic collection requirements in cloud computing environment
The traditional physical traffic collection network cannot directly collect the east-west traffic in the cloud computing environment, which leads to the blind spot of the business traffic in the cloud computing environment:
(1) The cloud computing environment east-west traffic cannot be directly collected, so that the application system in the cloud computing environment cannot deploy monitoring detection based on real-time business data flow, we cannot timely discover the real operation of the cloud computing environment of the application system business, which brings certain hidden dangers to the healthy and stable operation of the application system in the cloud computing environment;
(2) The east-west traffic cannot be directly collected in the cloud computing environment, which makes it impossible to directly extract data packets for analysis when problems occur in the business application in the virtual environment, which brings certain difficulties to fault location;
(3) With the increasingly stringent requirements of network security and various audits, such as BPC application transaction monitoring, IDS intrusion detection system, email and customer service recording audit system, the demand for east and west traffic collection in cloud computing environment is becoming more and more urgent.
Based on the above situation, it has become an inevitable trend to realize the extraction of east-west traffic data in cloud computing environment. We must keep pace with The Times and introduce new east-west traffic collection technology in cloud computing environment, so that the application system deployed in the cloud computing environment can also have perfect monitoring support, and can use packet capture to analyze the problem and track the data flow when problems and failures occur. The realization of east-west traffic extraction and analysis in cloud computing environment is a powerful magic weapon to ensure the stable operation of application systems deployed in cloud computing environment.
.
Selection of traffic collection mode in traditional cloud computing
environment
In the cloud computing environment, the traffic is not captured by the monitoring probe of the physical network, which brings difficulties to the monitoring virtualization system. At present, the solutions that can realize the traffic monitoring in the cloud computing environment can be divided into network element collection mode, Agent mode and virtual machine mode according to the location of the collection point that can be deployed on the computing node.
Network element capturing mode: virtual network elements (usually virtual switches) directly provide virtual traffic mirroring capabilities. Users can collect virtual traffic by calling the corresponding API. Different from policy collection, the granularity and flexibility of network element collection are mostly limited by the open capabilities of network element interface API. Unable to achieve fine-grained control by itself affects the performance of virtual network elements.
Agent mode: Agent is installed on each virtual machine that needs to collect traffic in the cloud computing environment, and the east-west traffic is extracted and distributed to each analysis platform through Agent. Too many agents need to be managed, and the influence of the Agent itself cannot be excluded when the fault occurs. The existing production network card needs to be shared to spat traffic, which may affect the business interaction.
Virtual machine mode: a unified collection virtual machine (collection soft probe) is installed on each physical host in the cloud computing environment, and the traffic of the host is mirrored to the collection probe virtual machine by mirroring traffic on the virtual switch, and then distributed to each monitoring and analysis platform. The collection virtual machine passively receives traffic, and the size of the traffic that can be mirrored is determined by the performance of the virtual switch, which has a certain impact on the stability of the virtual switch. The management and maintenance are particularly complex, and the system resource overhead is too large for each host to install multiple monitoring systems. This resource overhead is difficult to accept, and not all traffic analysis systems have an ingestion virtual machine version.
Matrix-SDN realizes traffic collection in cloud computing environment
Collection of virtual environment:
The vTAP traffic collection software is deployed in the virtual environment, which has low resource consumption and complete traffic preprocessing capabilities. The vTAP traffic collection software can be deployed and implemented without modifications to existing systems, with minimal dependency on and impact on production systems.
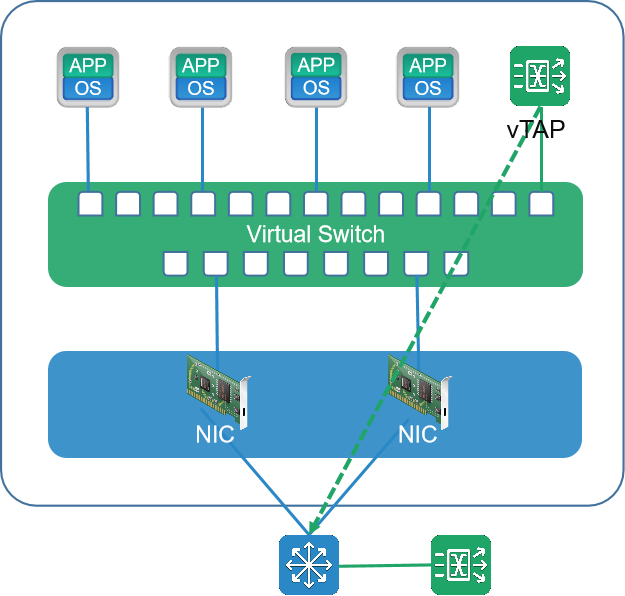
.vtap is used to collect the east-west traffic interacting between virtual machines in the same physical host, and the vTAP traffic collection software is used to configure the collection rules to realize fine collection and drainage control. The vTAP traffic collection software can mirror all network traffic and forward it to the back-end system for analysis and processing. In addition, vTAP supports filtering based on seven tuples (source IP, destination IP, source port, destination port, protocol number, physical port, VLAN), packet characteristics, deep identification of packet content, and IP network segment. vTAP can preprocess traffic according to fine-grained ACL strategies (deduplication, desensitization, truncation, encapsulation, etc.) to reduce the traffic output performance of virtualization environment. Improve the efficiency of your back-end analytics tools.
vTAP supports port/policy level traffic real-time monitoring, alarm monitoring, historical traffic statistics query, and provides a graph-based tool that can detect the traffic type, traffic size, and traffic application distribution of a certain link. The traffic visualization processor supports the function of traffic visualization detection, which performs basic analysis, DPI depth analysis, and precise fault analysis on the captured target traffic.
By helping users build high-performance collectors, it improves the utilization of virtualization resources and the security of virtualization services, realizes fine management of customer services, reduces the complexity of virtual network operation and maintenance, and allows enterprises to focus more on the development of business.
Cloud computing environment collection:
In the cloud computing environment, the traffic collection network is mainly composed of the traffic collection management platform and the virtual machine (vTAP) which is deployed on the physical host of the virtualization platform. Combined with the MATRIX-SDN traffic data collection network, vTAP traffic collection software is deployed to collect east-west packets between virtual machines in the virtualization environment. Realize the centralized control of traffic data with "full coverage of east-west traffic". The vTAP software does not need to transform the existing system when it is deployed and implemented, which meets the characteristics of zero dependence on deployment, zero policy interference, and low resource consumption in the virtualized network environment.

The MATRIX-SDN platform is oriented to cloud business, and supports users to customize fine filtering strategies according to applications and services to reduce unnecessary collection consumption. Support VMware, OpenStack, Hyper-v virtualization environment deployment. The traffic distribution based on logical network objects and business objects is completely decoupled from other functional components, and the collected data can be docked with any traffic analysis tool, further reducing the operating cost of users. Through network topology and virtual network traffic statistics, a panoramic view of the virtual network is presented in a 360-degree perspective, which helps users to sort out the correspondence between east-west traffic and virtual machines. Its innovation and application value are as follows:
vTAP traffic acquisition software was used to configure acquisition rules to realize fine acquisition and drainage control. The vTAP traffic collection software can also mirror all network traffic and forward it to the back-end system for analysis and processing. In addition, vTAP supports filtering based on seven tuples (source IP, destination IP, source port, destination port, protocol number, physical port, VLAN), packet characteristics, deep identification of packet content, and IP network segment. vTAP can preprocess traffic according to fine-grained ACL strategies (deduplication, desensitization, truncation, encapsulation, etc.) to reduce the traffic output performance of virtualization environment. • Improving the efficiency of back-end analytics tools
MATRIX-SDN platform unified control, SDN controller unified control vTAP, The SDN controller is responsible for the deployment of vTAP, the configuration and distribution of vTAP software policies in the virtual environment, and the establishment of tunnels (GRE, VxLAN, ERSPAN, etc.) between vTAP software and physical TAP devices in the physical collection network. The SDN controller uniformly manages vTAP devices and does not need to maintain each vTAP. The device can execute a variety of different types of traffic processing strategies issued by the controller, collect, process and output the virtual network traffic and infrastructure information, realize the full link monitoring of the business network, quantify the performance of the business network, and help the enterprise to realize the global optimization of online business.
The flexible policy detection function of MATRIX-SDN platform captures and monitors the traffic of a specific period of time in real time. Based on the traffic trend detection function can realize: based on specific one or more traffic data virtual collection points to issue a specific traffic statistics policy only for monitoring and counting. After issuing a dynamic traffic statistical strategy, the MATRIX-SDN platform can monitor the traffic trend of the issued strategy in real time, and can also continue to monitor the historical traffic after a period of time for query and display. At the same time, through the collaborative work between the visual analysis system and the traffic collection network, once the network is abnormal, the "traffic snapshot technology" will be used to "photograph/video" any type of traffic at any collection point, so as to accurately save the abnormal field data at multiple locations in the network.
Matrix-SDN integrates virtual-real traffic management
The integration of advanced SDN technology and advanced NP+ASIC chips to build a scientific traffic data collection network, based on the ability of "combination of virtual and real, integrated cloud collection", comprehensively solve a large number of applications in data center virtualization/cloud network, the data interaction between virtual servers may only reflect the memory data exchange within the same server. It is difficult to obtain virtualization/cloud network traffic data, so it is necessary to construct comprehensive coverage east-west traffic data for business analysis/security detection analysis. So as to realize the full coverage of traffic data collection and eliminate the monitoring blind spot. Based on the business data type, the traffic data is sorted out, different classification flow data is established with different business systems, and the distribution management control of traffic data is carried out with different classification, and the traffic data is provided to different traffic data analysis tools with the principle of "minimizing data permissions", so as to reduce the security risk of traffic data and improve the security of traffic data. It shows the logical topology architecture of the current network in a unified way, clearly shows the logical location and collection mode of the current network where the traffic data collection point is located, shows the topology architecture of the traffic collection network itself in a unified way, and monitors and manages the working status of the collection unit and the traffic distribution status in real time. So as to achieve the logical topology of the traffic source, processing process and destination visualization. Clearly show the traffic collection location, processing strategy, input and output information, so that the control strategy of traffic data is changed from complex to simple. The dynamic acquisition ability of traffic data provides flexible data detection hand and convenient data detection function, which performs dynamic data detection on any covered collection point location and directly detects traffic data information of communication endpoints, so that operation and maintenance personnel can obtain the original data they want to analyze at anytime and anywhere. It is a powerful security operation and maintenance support tool. Direct the most effective and efficient means of locating and resolving faults. Realize traffic data visualization, unified centralized control.
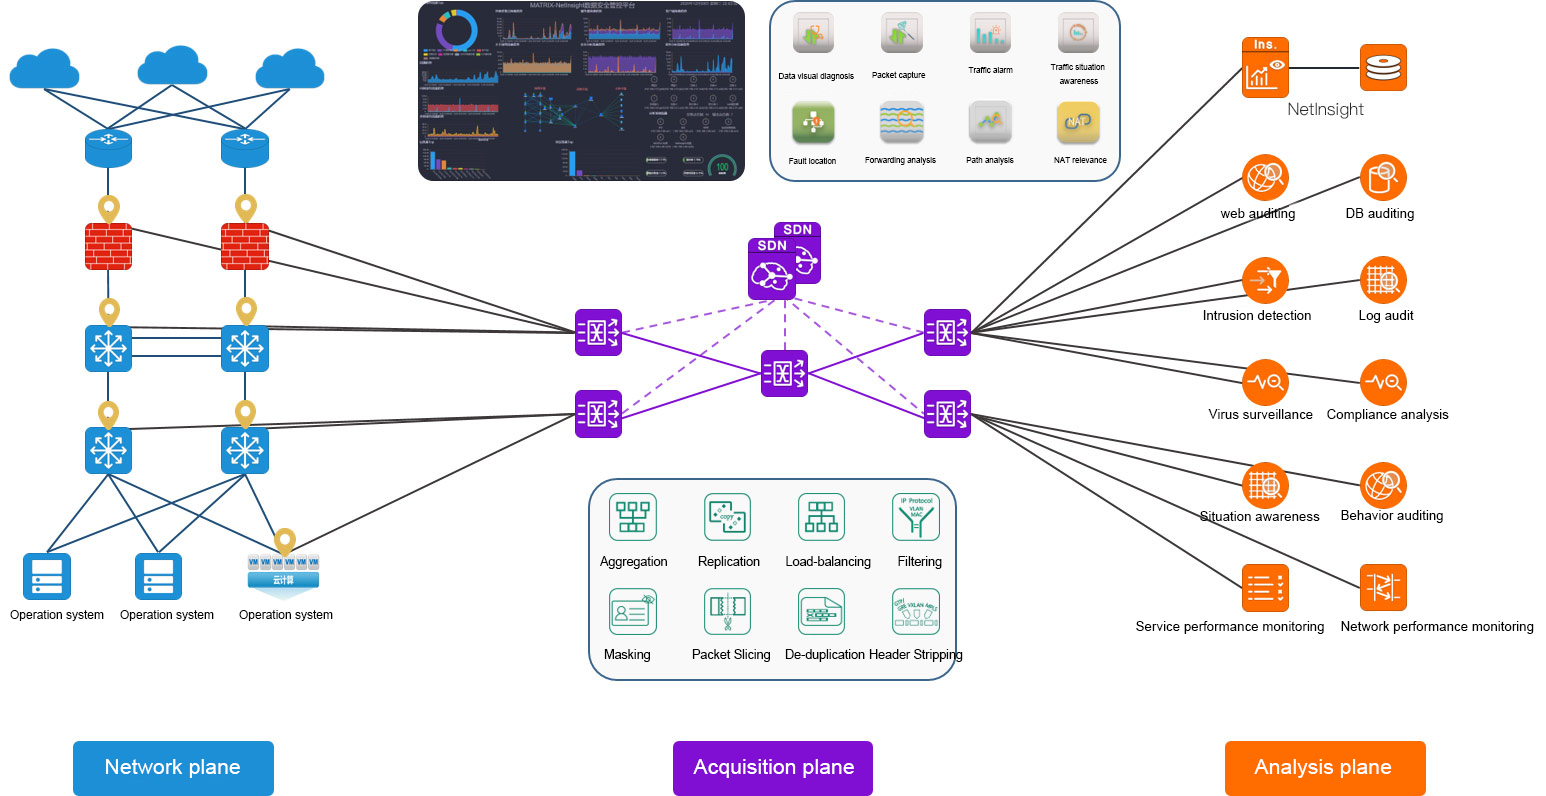
NT-VTAP components:
VTAP Virtual Acquisition module (software) - runs on the cloud implementation machine in the form of virtualization software. It is actually a virtual machine that is responsible for receiving data packets from the VSWITCH, performing secondary tunnel encapsulation and sending them to the physical aggregation and distribution device or other external analysis equipment. Main functional points:
a) Receive the mirror traffic from the vswitch/OVS layer, realize the collection and secondary tunnel packaging of traffic data, and drain to the VPP series visual control equipment unit for unified traffic management.
b) Realize packet decoding of received traffic, realize seven-tuple filtering of specific packets based on user control policy, perform flow table tracking, and realize different packet action processing based on different data flow tables.
c) Realize the compression processing function of data stream, including data packet deduplication and truncation based on different data message types.
With the development of IT information technology, network traffic data analysis in the field of information security and IT operation and maintenance has become indispensable. The underlying basis of "network traffic analysis" is the collection of data packets transmitted in real time in the network, and further statistical analysis is carried out based on the analysis of relevant information in the original data packets, such as Network performance Analysis (NPM) and Service Performance Analysis (APM). The former is for network performance indicators, such as: Bandwidth, delay, jitter, packet loss, retransmission, congestion, network attacks and other analysis of statistics and fault location, the latter mainly according to the specific characteristics of data packets carrying the service, analysis of service quality. The meaning of "packet deduplication" is to remove the repeated packets collected, and in the process of data collection, "packet deduplication" has important application value.
Why duplicate packets are collected:
The current business environment involves many network elements, hosts, servers, databases, middleware and so on. When a client accesses a business system, it involves client initiation, server response, connection establishment, data transmission, context correlation, security policy, and network element nodes. In order to realize the comprehensive control, security, optimization and operation and maintenance requirements of transactions, it is necessary to collect and analyze traffic data node by node. The deployment of the capturing site in this diagram is as follows: switching equipment output through port mirror, firewall output through splitter, collection and summary through traffic capturing system, and traffic data is sent to analysis system.
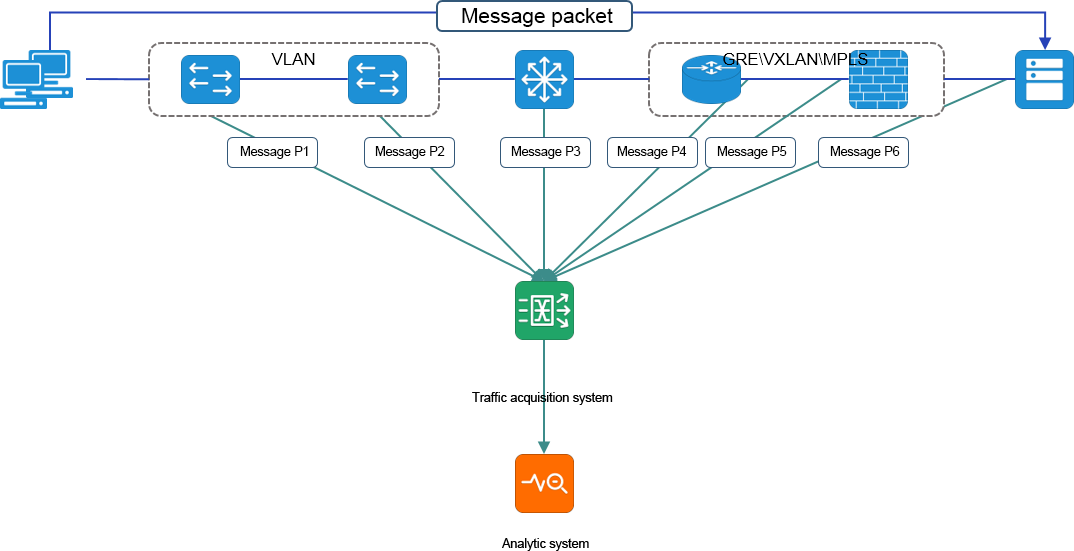
The data packet sent from the client to the server is transmitted through the network. For the network analysis system, there are usually multiple data collection points in the whole network, so the packets P1, P2, P3, P4, P5 will be captured at each collection point respectively. These packets are related to the original packet, called the same source packet. Because of the different network locations, the packet encapsulation and some characteristic bytes differ. The packets P1 and P2 are collected by mirroring at two collection points on the same link, and these two packets are exactly the same. Compared with packets P1 and P2, packet P3 carries the same Payload; VLAN tag exists in packets P1 and P2, but P3 does not have VLAN tag. Compared with packet P3, packet P4 has different values of IP address, MAC address, IP_TTL, IP_Checksum, etc., because it is forwarded by a routing device. The data of packet P5 is encapsulated with tunnel protocols such as GRE, MPLS and VxLAN, and the Payload part is the same as that of packet P4. Compared with packet P5, packet p6 has different values of packet TCP seq, TCP ack, etc., because it is forwarded by a firewall device. Each of the above same source packets can be called "duplicate packets" according to the definition of actual application requirements. According to the needs of back-end analysis system, redundant packets are removed. One data packet is reserved and output to the back-end network analysis system.
Impact of duplicate packets on back-end analysis:
The collection and summary of multi-point traffic data will produce repeated traffic data, and it is difficult for conventional analysis systems to distinguish repeated traffic data. Multiple acquisition of the same packet will make the analysis system understand the behavior of network retransmission or multiple business transactions. As a result, the performance of the analysis system is reduced and the analysis is distorted.
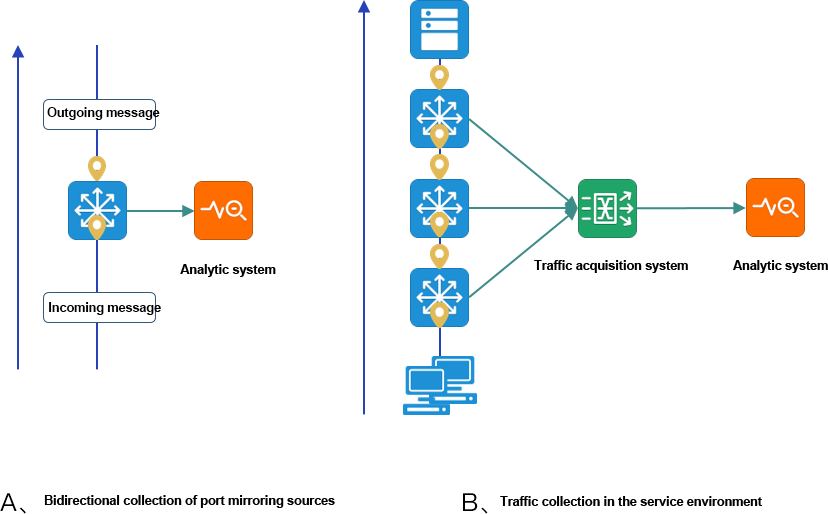
Figure A Port image of the environment Because of the bidirectional traffic collection, two traffic flows in and out of the switch port will cause the analysis system to receive two duplicate data.
Flow collection and summary in the environment of Figure B. The data sent to the analysis system will make the analysis system receive six duplicate data.
In multi-point traffic data collection and traffic aggregation scenario, the same traffic data is output to the back-end analysis system through the traffic collection system in accordance with the established queue, resulting in the analysis system unable to identify out-of-order packets, resulting in analysis distortion.
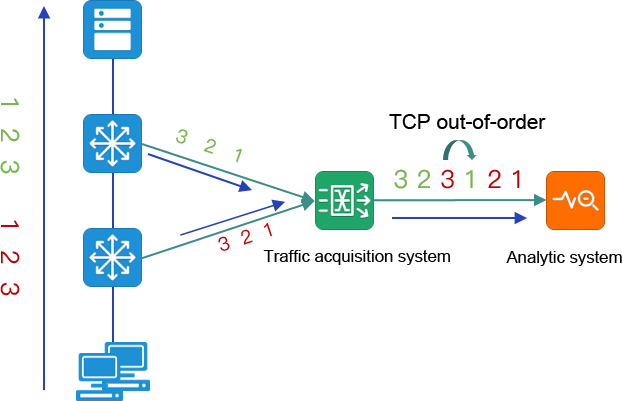
When the traffic data is aggregated, if the session queue information passing through the first device is not finished, and the second device starts to send the same session queue information, the traffic data of the two queues may be intertwined, and the message information of each queue is complete and correct. However, the analysis system cannot distinguish the difference between the packets of the two queues, which leads to the belief that there is TCP disorder in the network communication.
The NetTAP implementation removes duplicate packets:
NetTAP traffic collection system deduplication function, according to the characteristics of packet duplication, as well as the analysis of the system deduplication requirements, the collected packets will be compared one by one, if duplication phenomenon is found, the subsequent incoming duplicate packets will be discarded. Only the first data is output to ensure that the analysis system can correctly process the traffic data, and also offload the analysis system.
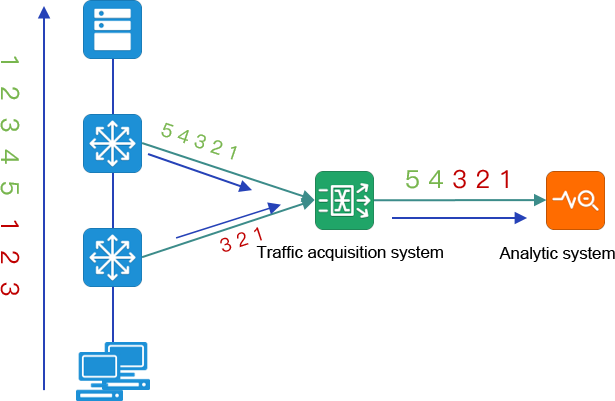
TAP traffic collection system takes the original information of Sip, Dip, Sport, Dport, TCP seq, TCP ack, Payload and other parameters of the packet as deduplication identification, and calculates a specific fingerprint information of the packet deduplication identification. Firstly, the specific fingerprint information calculated by the packet identification is compared, and if the fingerprint information is the same, then it compares the original information of the message deduplicated identification. If all of them are the same, it is judged as a duplicate message, and only the first message is forwarded, and the subsequent duplicate messages are removed. At the same time, a convergence time is added to the specific fingerprint information calculated by the deduplicated identification. If no packet comparison is performed in a convergence time, the deduplicated identification is aging, and the deduplicated identification is emptied. If there are packets to compare at the end of the convergence time, the convergence time of the deduplication will be reset.
Deduplication of tunnel packets (GRE/MPLS/VxLAN), etc. To deduplicate packets inside the tunnel protocol encapsulation, the packets need to be first deencapsulated, and then deduplicated according to the above deduplication method.
Application Scenarios of packet deduplication in Network traffic Analysis:
In the IT network, application analysis systems are usually deployed for the needs of business operation and supervision. These systems often obtain the specified business data flow from the front-end traffic collection equipment for multi-dimensional index analysis, such as: business response rate, business connection success rate, transaction volume and other information. In order to cover different application analysis scenarios, it is necessary to perform different means of deduplication preprocessing based on the deployment status of acquisition nodes, the location of analysis nodes, and the analysis goal of traffic before entering the application analysis system:
1. Global-based deduplication
When analyzing network traffic application, it is necessary to deploy multiple acquisition nodes in the business environment involving network element nodes to ensure the comprehensiveness and integrity of data. It is inevitable to cause part of the traffic to be repeatedly collected, and finally because of these repeated and redundant data, the analysis system will receive more traffic than the analysis capacity, data packet loss, and performance waste. The results of the analysis are inaccurate and misjudged.
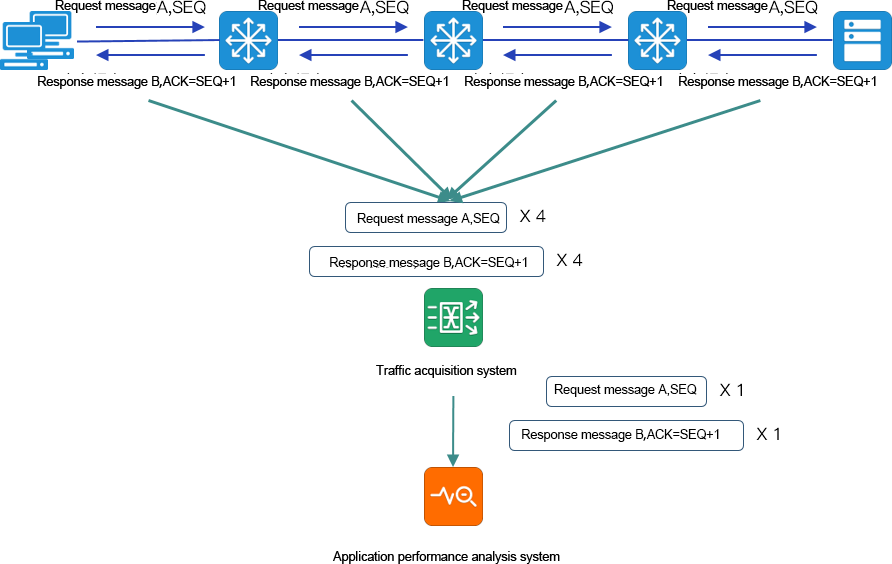
As shown in the figure above, the NetTAP traffic collection system uniformly converges the traffic of all collection nodes and performs effective deduplication before outputting to the back-end application analysis system. It can ensure that the number of packets obtained by the application analysis system is consistent with the packets transmitted by the original network and the structure is complete, so that the index analysis results are consistent with the actual operation of the current network business, and the accurate and effective application analysis value is realized.
2. Deduplication based on firewall packet changes
In the application analysis, when the traffic is forwarded through the firewall, for the security consideration of the traffic flow, the SEQ and ACK fields of the packet will be randomly changed, and the conventional deduplication mechanism will be used to deduplicate and output, so that the two packets (request packet A, SEQ) and (response packet B, ACK=SEQ '+1) will be output. According to the deduplication mechanism based on tcp_seq/ tcp_ack changes, four kinds of packets will be output: (request packet A, SEQ), (request packet A, SEQ '), (response packet B, ACK=SEQ+1), (response packet B, ACK=SEQ '+1). As a result, the application analysis system cannot effectively associate and recombine them, resulting in the deviation of index analysis, the inaccurate analysis results, misjudgment and so on.
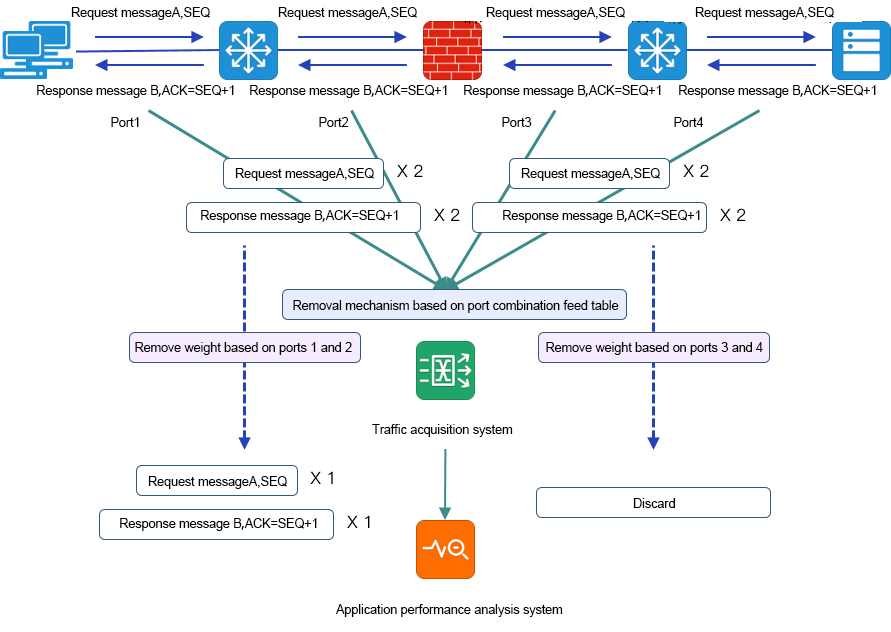
As shown in the figure above, the NetTAP traffic collection system relates flow table information to the deduplication mechanism, and binds the collection port packets in front of the wall and the collection port packets behind the wall. Since the data in front of the wall and behind the wall are the same flow table, but the SEQ and ACK fields of the packets after the data passing through the firewall are different, only the packets in the first port group (front of the wall) are retained. Since the packet flow table of the rear incoming port group (behind the wall) is consistent with the packet flow table of the front wall port group, it is determined to be a duplicate packet and is discarded directly. So it can meet the application analysis system for the same business through the firewall packets effective correlation analysis.
3. Port-based deduplication
In the application analysis, when the business traffic is forwarded through the firewall, the firewall will not change the SEQ and ACK fields of the packet. At the same time, when the data in front of the wall and behind the wall are analyzed separately, the data in front of the wall and behind the wall need to be classified and output to different application analysis systems in the back end. At this time, according to the conventional duplication removal mechanism, the data classification output cannot be achieved.
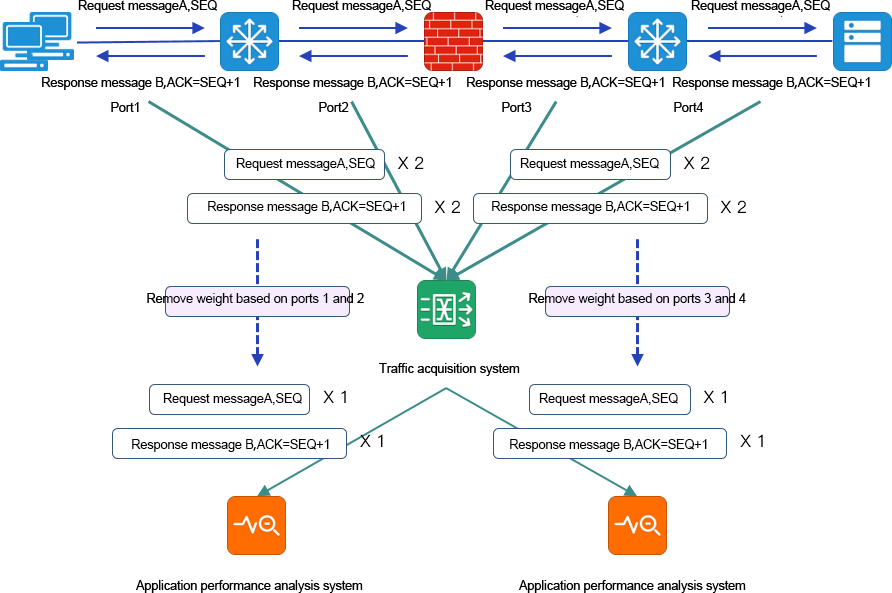
As shown in the figure above, based on the deduplication of packet binding of different traffic input ports, NetTAP traffic collection system can subdivide the traffic of different network location areas, different application business monitoring nodes, and before and after the firewall, so as to meet the hierarchical monitoring and analysis of different data source objects on the same service path by application analysis and control system.
4. Policy-based deduplication
In the process of application analysis and network analysis of network traffic, it is necessary to deduplicate part of the traffic data and slice part of the traffic data. At this time, according to the conventional global deduplication mechanism, the output of the demand traffic data classification cannot be realized.
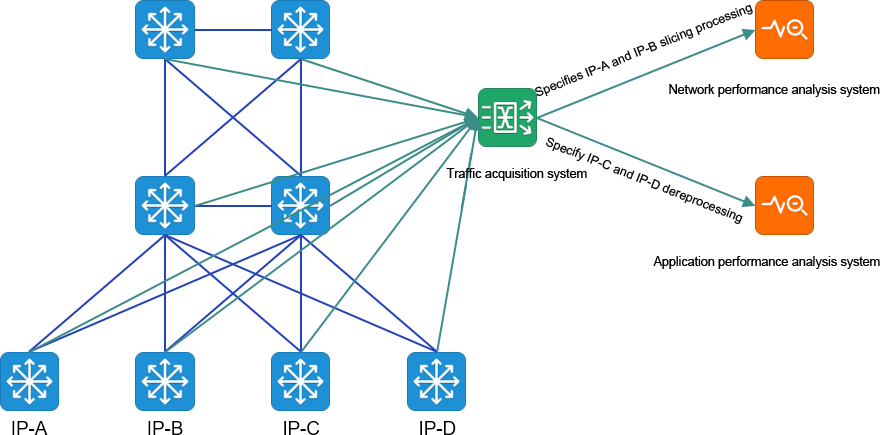
As shown in the figure above, based on different traffic matching strategies, NetTAP traffic collection system can independently preprocess different characteristics/types of packets and output them to the back-end analysis system with different data requirements on demand, so as to realize the traffic classification preprocessing deep down to the policy level.
Tel:400-8853-028 028-84776105 Add: 2F, G4 of TianFu Software Park, Chengdu, China.
Copyright
 Copyright 2020 NetTAP Chengdu Shuwei Communication Technology Co., LTD. All Rights reserved


 联系我们
联系我们